Guyanese vs Immigrants from Germany Single Female Poverty
COMPARE
Guyanese
Immigrants from Germany
Single Female Poverty
Single Female Poverty Comparison
Guyanese
Immigrants from Germany
21.0%
SINGLE FEMALE POVERTY
52.0/ 100
METRIC RATING
172nd/ 347
METRIC RANK
21.3%
SINGLE FEMALE POVERTY
31.1/ 100
METRIC RATING
191st/ 347
METRIC RANK
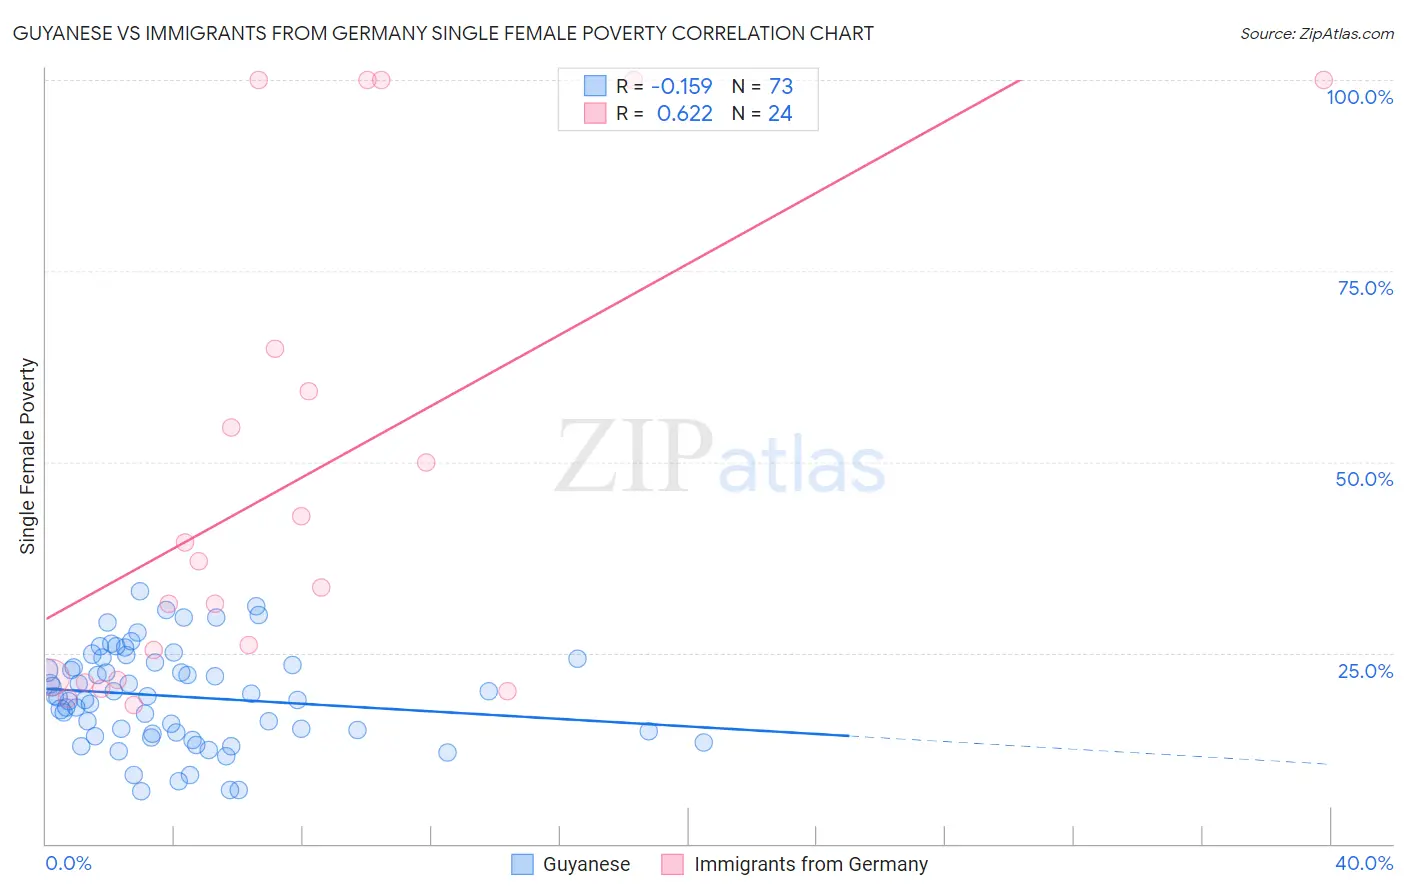
Guyanese vs Immigrants from Germany Single Female Poverty Correlation Chart
The statistical analysis conducted on geographies consisting of 175,255,160 people shows a poor negative correlation between the proportion of Guyanese and poverty level among single females in the United States with a correlation coefficient (R) of -0.159 and weighted average of 21.0%. Similarly, the statistical analysis conducted on geographies consisting of 454,450,441 people shows a significant positive correlation between the proportion of Immigrants from Germany and poverty level among single females in the United States with a correlation coefficient (R) of 0.622 and weighted average of 21.3%, a difference of 1.4%.
Single Female Poverty Correlation Summary
| Measurement | Guyanese | Immigrants from Germany |
| Minimum | 6.8% | 18.2% |
| Maximum | 33.1% | 100.0% |
| Range | 26.2% | 81.8% |
| Mean | 19.3% | 47.4% |
| Median | 19.3% | 35.2% |
| Interquartile 25% (IQ1) | 14.4% | 21.6% |
| Interquartile 75% (IQ3) | 23.9% | 62.1% |
| Interquartile Range (IQR) | 9.5% | 40.4% |
| Standard Deviation (Sample) | 6.3% | 30.5% |
| Standard Deviation (Population) | 6.3% | 29.8% |
Demographics Similar to Guyanese and Immigrants from Germany by Single Female Poverty
In terms of single female poverty, the demographic groups most similar to Guyanese are Moroccan (21.0%, a difference of 0.050%), Immigrants from Guyana (21.0%, a difference of 0.090%), Cuban (21.0%, a difference of 0.13%), Czech (21.0%, a difference of 0.33%), and Canadian (21.1%, a difference of 0.41%). Similarly, the demographic groups most similar to Immigrants from Germany are Immigrants from Cuba (21.2%, a difference of 0.29%), Trinidadian and Tobagonian (21.2%, a difference of 0.29%), Yugoslavian (21.2%, a difference of 0.30%), Immigrants from Nigeria (21.2%, a difference of 0.39%), and Hawaiian (21.2%, a difference of 0.45%).
| Demographics | Rating | Rank | Single Female Poverty |
| Moroccans | 52.8 /100 | #171 | Average 21.0% |
| Guyanese | 52.0 /100 | #172 | Average 21.0% |
| Immigrants | Guyana | 50.6 /100 | #173 | Average 21.0% |
| Cubans | 50.0 /100 | #174 | Average 21.0% |
| Czechs | 46.8 /100 | #175 | Average 21.0% |
| Canadians | 45.4 /100 | #176 | Average 21.1% |
| Scandinavians | 45.2 /100 | #177 | Average 21.1% |
| Immigrants | Bosnia and Herzegovina | 44.9 /100 | #178 | Average 21.1% |
| British | 42.9 /100 | #179 | Average 21.1% |
| Spanish American Indians | 42.5 /100 | #180 | Average 21.1% |
| Europeans | 42.3 /100 | #181 | Average 21.1% |
| Slavs | 40.5 /100 | #182 | Average 21.1% |
| Slovaks | 39.7 /100 | #183 | Fair 21.1% |
| Hungarians | 39.6 /100 | #184 | Fair 21.1% |
| Immigrants | Cambodia | 38.2 /100 | #185 | Fair 21.2% |
| Hawaiians | 37.7 /100 | #186 | Fair 21.2% |
| Immigrants | Nigeria | 36.8 /100 | #187 | Fair 21.2% |
| Yugoslavians | 35.4 /100 | #188 | Fair 21.2% |
| Immigrants | Cuba | 35.3 /100 | #189 | Fair 21.2% |
| Trinidadians and Tobagonians | 35.2 /100 | #190 | Fair 21.2% |
| Immigrants | Germany | 31.1 /100 | #191 | Fair 21.3% |