Guyanese vs Ecuadorian Single Mother Poverty
COMPARE
Guyanese
Ecuadorian
Single Mother Poverty
Single Mother Poverty Comparison
Guyanese
Ecuadorians
29.8%
SINGLE MOTHER POVERTY
12.8/ 100
METRIC RATING
211th/ 347
METRIC RANK
30.8%
SINGLE MOTHER POVERTY
0.9/ 100
METRIC RATING
246th/ 347
METRIC RANK
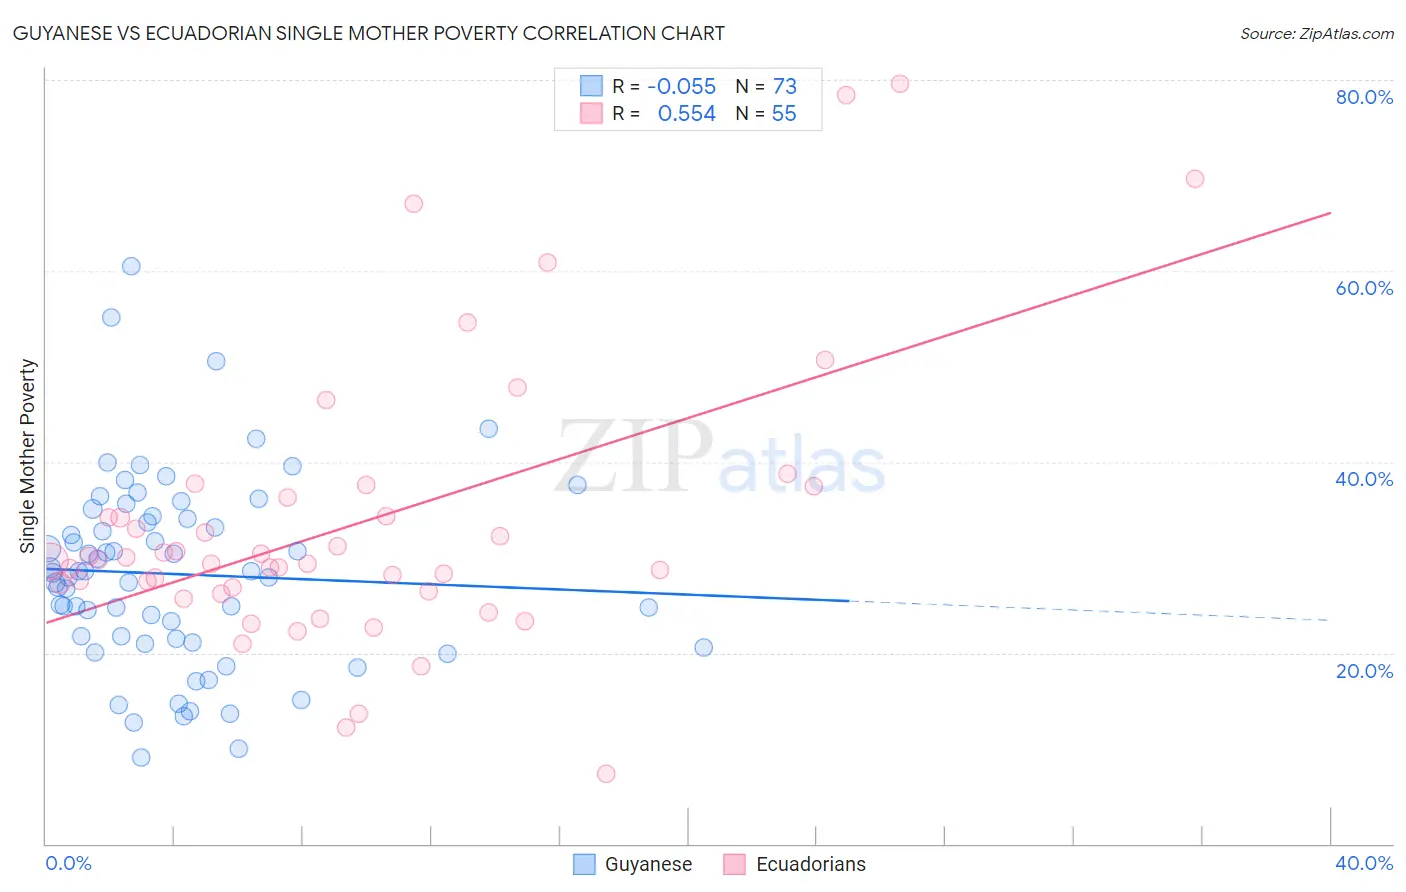
Guyanese vs Ecuadorian Single Mother Poverty Correlation Chart
The statistical analysis conducted on geographies consisting of 174,134,686 people shows a slight negative correlation between the proportion of Guyanese and poverty level among single mothers in the United States with a correlation coefficient (R) of -0.055 and weighted average of 29.8%. Similarly, the statistical analysis conducted on geographies consisting of 311,375,048 people shows a substantial positive correlation between the proportion of Ecuadorians and poverty level among single mothers in the United States with a correlation coefficient (R) of 0.554 and weighted average of 30.8%, a difference of 3.2%.
Single Mother Poverty Correlation Summary
| Measurement | Guyanese | Ecuadorian |
| Minimum | 9.1% | 7.3% |
| Maximum | 60.5% | 79.6% |
| Range | 51.4% | 72.3% |
| Mean | 28.2% | 33.5% |
| Median | 28.4% | 29.6% |
| Interquartile 25% (IQ1) | 21.3% | 26.5% |
| Interquartile 75% (IQ3) | 34.2% | 36.2% |
| Interquartile Range (IQR) | 12.9% | 9.8% |
| Standard Deviation (Sample) | 9.9% | 14.7% |
| Standard Deviation (Population) | 9.9% | 14.6% |
Similar Demographics by Single Mother Poverty
Demographics Similar to Guyanese by Single Mother Poverty
In terms of single mother poverty, the demographic groups most similar to Guyanese are Nicaraguan (29.8%, a difference of 0.040%), Haitian (29.8%, a difference of 0.050%), Immigrants from Thailand (29.9%, a difference of 0.090%), Irish (29.8%, a difference of 0.11%), and Liberian (29.9%, a difference of 0.12%).
| Demographics | Rating | Rank | Single Mother Poverty |
| Immigrants | Immigrants | 16.6 /100 | #204 | Poor 29.7% |
| Czechoslovakians | 16.1 /100 | #205 | Poor 29.7% |
| Immigrants | Haiti | 15.8 /100 | #206 | Poor 29.7% |
| Immigrants | Panama | 15.5 /100 | #207 | Poor 29.8% |
| Immigrants | Guyana | 14.7 /100 | #208 | Poor 29.8% |
| Irish | 13.9 /100 | #209 | Poor 29.8% |
| Haitians | 13.3 /100 | #210 | Poor 29.8% |
| Guyanese | 12.8 /100 | #211 | Poor 29.8% |
| Nicaraguans | 12.4 /100 | #212 | Poor 29.8% |
| Immigrants | Thailand | 12.0 /100 | #213 | Poor 29.9% |
| Liberians | 11.7 /100 | #214 | Poor 29.9% |
| Jamaicans | 11.7 /100 | #215 | Poor 29.9% |
| Immigrants | Western Africa | 11.5 /100 | #216 | Poor 29.9% |
| Immigrants | Ghana | 11.3 /100 | #217 | Poor 29.9% |
| Hungarians | 10.3 /100 | #218 | Poor 29.9% |
Demographics Similar to Ecuadorians by Single Mother Poverty
In terms of single mother poverty, the demographic groups most similar to Ecuadorians are West Indian (30.8%, a difference of 0.040%), French Canadian (30.8%, a difference of 0.080%), Cape Verdean (30.8%, a difference of 0.15%), Vietnamese (30.9%, a difference of 0.30%), and Barbadian (30.7%, a difference of 0.40%).
| Demographics | Rating | Rank | Single Mother Poverty |
| Immigrants | Portugal | 2.1 /100 | #239 | Tragic 30.5% |
| Salvadorans | 1.8 /100 | #240 | Tragic 30.6% |
| Immigrants | Laos | 1.8 /100 | #241 | Tragic 30.6% |
| Immigrants | Burma/Myanmar | 1.7 /100 | #242 | Tragic 30.6% |
| Bermudans | 1.6 /100 | #243 | Tragic 30.6% |
| French | 1.3 /100 | #244 | Tragic 30.7% |
| Barbadians | 1.3 /100 | #245 | Tragic 30.7% |
| Ecuadorians | 0.9 /100 | #246 | Tragic 30.8% |
| West Indians | 0.9 /100 | #247 | Tragic 30.8% |
| French Canadians | 0.9 /100 | #248 | Tragic 30.8% |
| Cape Verdeans | 0.8 /100 | #249 | Tragic 30.8% |
| Vietnamese | 0.7 /100 | #250 | Tragic 30.9% |
| Tlingit-Haida | 0.6 /100 | #251 | Tragic 30.9% |
| Alaska Natives | 0.6 /100 | #252 | Tragic 30.9% |
| Celtics | 0.6 /100 | #253 | Tragic 30.9% |