Guyanese vs Samoan Single Mother Poverty

COMPARE

Guyanese
Race
Ancestry
AfghanAfricanAlaska NativeAlaskan AthabascanAlbanianAleutAlsatianAmericanApacheArabArapahoArgentineanArmenianAssyrian/Chaldean/SyriacAustralianAustrianBahamianBangladeshiBarbadianBasqueBelgianBelizeanBermudanBhutaneseBlackfeetBolivianBrazilianBritishBritish West IndianBulgarianBurmeseCajunCambodianCanadianCape VerdeanCarpatho RusynCelticCentral AmericanCentral American IndianCherokeeCheyenneChickasawChileanChineseChippewaChoctawColombianColvilleComancheCosta RicanCreeCreekCroatianCrowCubanCypriotCzechCzechoslovakianDanishDelawareDominicanDutchDutch West IndianEastern EuropeanEcuadorianEgyptianEnglishEstonianEthiopianEuropeanFijianFilipinoFinnishFrenchFrench American IndianFrench CanadianGermanGerman RussianGhanaianGreekGuamanian/ChamorroGuatemalanGuyaneseHaitianHmongHonduranHopiHoumaHungarianIcelanderIndian (Asian)IndonesianInupiatIranianIraqiIrishIroquoisIsraeliItalianJamaicanJapaneseJordanianKenyanKiowaKoreanLaotianLatvianLebaneseLiberianLithuanianLumbeeLuxembourgerMacedonianMalaysianMalteseMarshalleseMenomineeMexicanMexican American IndianMongolianMoroccanNative HawaiianNavajoNepaleseNew ZealanderNicaraguanNigerianNorthern EuropeanNorwegianOkinawanOsageOttawaPaiutePakistaniPalestinianPanamanianParaguayanPennsylvania GermanPeruvianPimaPolishPortuguesePotawatomiPuebloPuerto RicanPuget Sound SalishRomanianRussianSalvadoranScandinavianScotch-IrishScottishSeminoleSenegaleseSerbianShoshoneSierra LeoneanSiouxSlavicSlovakSloveneSomaliSouth AfricanSouth AmericanSouth American IndianSoviet UnionSpaniardSpanishSpanish AmericanSpanish American IndianSri LankanSubsaharan AfricanSudaneseSwedishSwissSyrianTaiwaneseThaiTlingit-HaidaTohono O'OdhamTonganTrinidadian and TobagonianTsimshianTurkishU.S. Virgin IslanderUgandanUkrainianUruguayanUteVenezuelanVietnameseWelshWest IndianYakamaYaquiYugoslavianYumanYup'ikZimbabwean
Immigration
NonimmigrantsImmigrantsAfghanistanAfricaAlbaniaArgentinaArmeniaAsiaAustraliaAustriaBahamasBangladeshBarbadosBelarusBelgiumBelizeBoliviaBosnia and HerzegovinaBrazilBulgariaBurma/MyanmarCabo VerdeCambodiaCameroonCanadaCaribbeanCentral AmericaChileChinaColombiaCongoCosta RicaCroatiaCubaCzechoslovakiaDenmarkDominicaDominican RepublicEastern AfricaEastern AsiaEastern EuropeEcuadorEgyptEl SalvadorEnglandEritreaEthiopiaEuropeFijiFranceGermanyGhanaGreeceGrenadaGuatemalaGuyanaHaitiHondurasHong KongHungaryIndiaIndonesiaIranIraqIrelandIsraelItalyJamaicaJapanJordanKazakhstanKenyaKoreaKuwaitLaosLatin AmericaLatviaLebanonLiberiaLithuaniaMalaysiaMexicoMicronesiaMiddle AfricaMoldovaMoroccoNepalNetherlandsNicaraguaNigeriaNorth AmericaNorth MacedoniaNorthern AfricaNorthern EuropeNorwayOceaniaPakistanPanamaPeruPhilippinesPolandPortugalRomaniaRussiaSaudi ArabiaScotlandSenegalSerbiaSierra LeoneSingaporeSomaliaSouth AfricaSouth AmericaSouth Central AsiaSouth Eastern AsiaSouthern EuropeSpainSri LankaSt. Vincent and the GrenadinesSudanSwedenSwitzerlandSyriaTaiwanThailandTrinidad and TobagoTurkeyUgandaUkraineUruguayUzbekistanVenezuelaVietnamWest IndiesWestern AfricaWestern AsiaWestern EuropeYemenZaireZimbabweAzores
Samoan
Race
Ancestry
AfghanAfricanAlaska NativeAlaskan AthabascanAlbanianAleutAlsatianAmericanApacheArabArapahoArgentineanArmenianAssyrian/Chaldean/SyriacAustralianAustrianBahamianBangladeshiBarbadianBasqueBelgianBelizeanBermudanBhutaneseBlackfeetBolivianBrazilianBritishBritish West IndianBulgarianBurmeseCajunCambodianCanadianCape VerdeanCarpatho RusynCelticCentral AmericanCentral American IndianCherokeeCheyenneChickasawChileanChineseChippewaChoctawColombianColvilleComancheCosta RicanCreeCreekCroatianCrowCubanCypriotCzechCzechoslovakianDanishDelawareDominicanDutchDutch West IndianEastern EuropeanEcuadorianEgyptianEnglishEstonianEthiopianEuropeanFijianFilipinoFinnishFrenchFrench American IndianFrench CanadianGermanGerman RussianGhanaianGreekGuamanian/ChamorroGuatemalanHaitianHmongHonduranHopiHoumaHungarianIcelanderIndian (Asian)IndonesianInupiatIranianIraqiIrishIroquoisIsraeliItalianJamaicanJapaneseJordanianKenyanKiowaKoreanLaotianLatvianLebaneseLiberianLithuanianLumbeeLuxembourgerMacedonianMalaysianMalteseMarshalleseMenomineeMexicanMexican American IndianMongolianMoroccanNative HawaiianNavajoNepaleseNew ZealanderNicaraguanNigerianNorthern EuropeanNorwegianOkinawanOsageOttawaPaiutePakistaniPalestinianPanamanianParaguayanPennsylvania GermanPeruvianPimaPolishPortuguesePotawatomiPuebloPuerto RicanPuget Sound SalishRomanianRussianSalvadoranSamoanScandinavianScotch-IrishScottishSeminoleSenegaleseSerbianShoshoneSierra LeoneanSiouxSlavicSlovakSloveneSomaliSouth AfricanSouth AmericanSouth American IndianSoviet UnionSpaniardSpanishSpanish AmericanSpanish American IndianSri LankanSubsaharan AfricanSudaneseSwedishSwissSyrianTaiwaneseThaiTlingit-HaidaTohono O'OdhamTonganTrinidadian and TobagonianTsimshianTurkishU.S. Virgin IslanderUgandanUkrainianUruguayanUteVenezuelanVietnameseWelshWest IndianYakamaYaquiYugoslavianYumanYup'ikZimbabwean
Immigration
NonimmigrantsImmigrantsAfghanistanAfricaAlbaniaArgentinaArmeniaAsiaAustraliaAustriaBahamasBangladeshBarbadosBelarusBelgiumBelizeBoliviaBosnia and HerzegovinaBrazilBulgariaBurma/MyanmarCabo VerdeCambodiaCameroonCanadaCaribbeanCentral AmericaChileChinaColombiaCongoCosta RicaCroatiaCubaCzechoslovakiaDenmarkDominicaDominican RepublicEastern AfricaEastern AsiaEastern EuropeEcuadorEgyptEl SalvadorEnglandEritreaEthiopiaEuropeFijiFranceGermanyGhanaGreeceGrenadaGuatemalaGuyanaHaitiHondurasHong KongHungaryIndiaIndonesiaIranIraqIrelandIsraelItalyJamaicaJapanJordanKazakhstanKenyaKoreaKuwaitLaosLatin AmericaLatviaLebanonLiberiaLithuaniaMalaysiaMexicoMicronesiaMiddle AfricaMoldovaMoroccoNepalNetherlandsNicaraguaNigeriaNorth AmericaNorth MacedoniaNorthern AfricaNorthern EuropeNorwayOceaniaPakistanPanamaPeruPhilippinesPolandPortugalRomaniaRussiaSaudi ArabiaScotlandSenegalSerbiaSierra LeoneSingaporeSomaliaSouth AfricaSouth AmericaSouth Central AsiaSouth Eastern AsiaSouthern EuropeSpainSri LankaSt. Vincent and the GrenadinesSudanSwedenSwitzerlandSyriaTaiwanThailandTrinidad and TobagoTurkeyUgandaUkraineUruguayUzbekistanVenezuelaVietnamWest IndiesWestern AfricaWestern AsiaWestern EuropeYemenZaireZimbabweAzores
Single Mother Poverty
Income
Poverty
Unemployment
Labor Participation
Family Structure
Vehicle Availability
Education Level
Disability

Single Mother Poverty Comparison

Guyanese

Samoans

Poor
Excellent
29.8%
SINGLE MOTHER POVERTY
12.8/ 100
METRIC RATING
211th/ 347
METRIC RANK
28.5%
SINGLE MOTHER POVERTY
88.1/ 100
METRIC RATING
139th/ 347
METRIC RANK

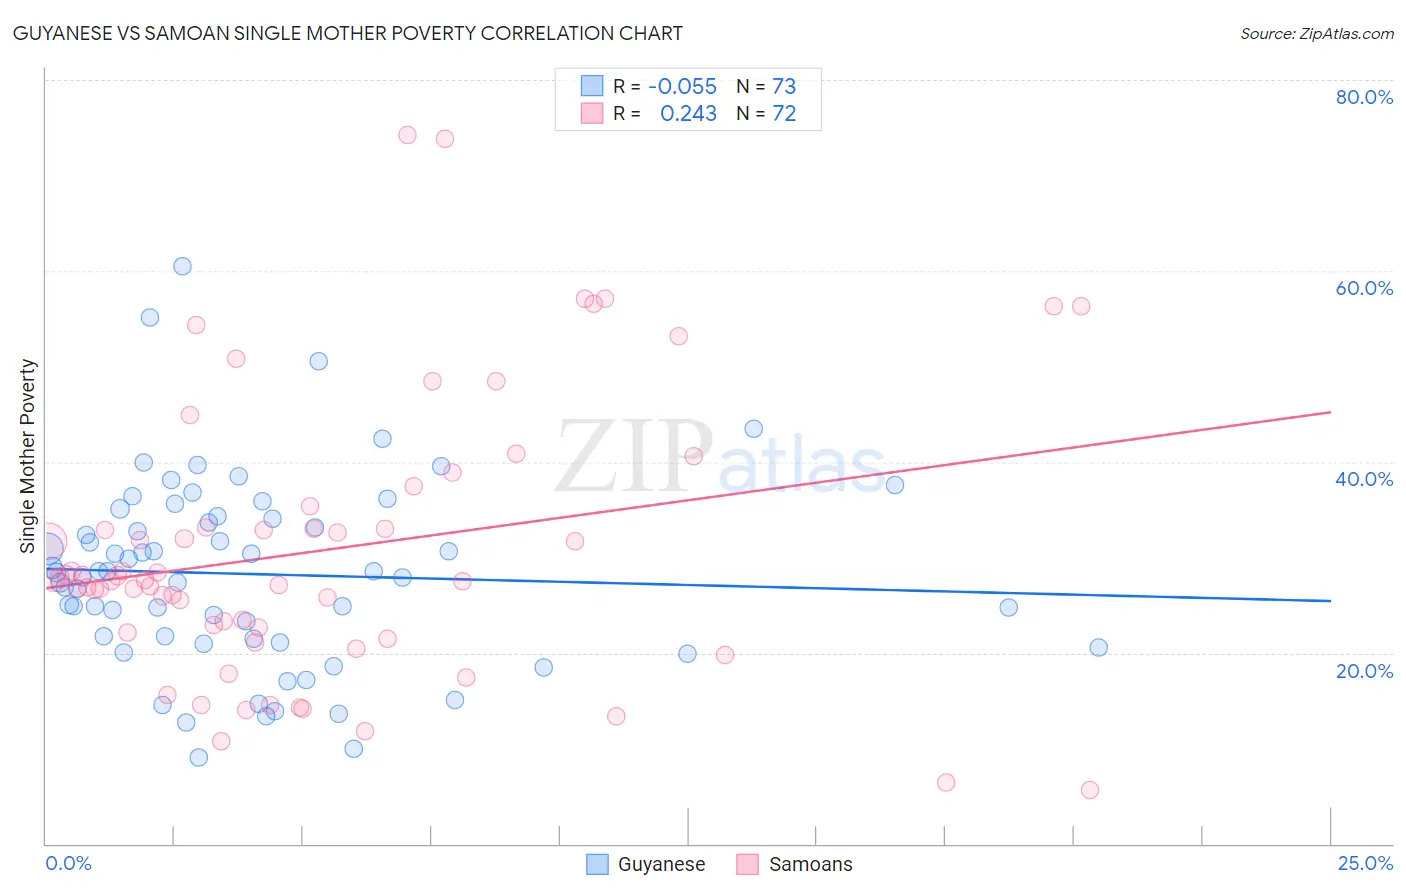
Guyanese vs Samoan Single Mother Poverty Correlation Chart

The statistical analysis conducted on geographies consisting of 174,134,686 people shows a slight negative correlation between the proportion of Guyanese and poverty level among single mothers in the United States with a correlation coefficient (R) of -0.055 and weighted average of 29.8%. Similarly, the statistical analysis conducted on geographies consisting of 223,207,663 people shows a weak positive correlation between the proportion of Samoans and poverty level among single mothers in the United States with a correlation coefficient (R) of 0.243 and weighted average of 28.5%, a difference of 4.8%.
Guyanese vs Samoan Single Mother Poverty

Single Mother Poverty Correlation Summary

MeasurementGuyaneseSamoan
Minimum9.1%5.6%
Maximum60.5%74.3%
Range51.4%68.7%
Mean28.2%30.8%
Median28.4%27.6%
Interquartile 25% (IQ1)21.3%22.4%
Interquartile 75% (IQ3)34.2%34.3%
Interquartile Range (IQR)12.9%11.9%
Standard Deviation (Sample)9.9%14.5%
Standard Deviation (Population)9.9%14.4%

Similar Demographics by Single Mother Poverty

Demographics Similar to Guyanese by Single Mother Poverty

In terms of single mother poverty, the demographic groups most similar to Guyanese are Nicaraguan (29.8%, a difference of 0.040%), Haitian (29.8%, a difference of 0.050%), Immigrants from Thailand (29.9%, a difference of 0.090%), Irish (29.8%, a difference of 0.11%), and Liberian (29.9%, a difference of 0.12%).
DemographicsRating | RankSingle Mother Poverty
Immigrants | Immigrants
16.6
/100
|
#204
Poor
29.7%
Czechoslovakians
16.1
/100
|
#205
Poor
29.7%
Immigrants | Haiti
15.8
/100
|
#206
Poor
29.7%
Immigrants | Panama
15.5
/100
|
#207
Poor
29.8%
Immigrants | Guyana
14.7
/100
|
#208
Poor
29.8%
Irish
13.9
/100
|
#209
Poor
29.8%
Haitians
13.3
/100
|
#210
Poor
29.8%
Guyanese
12.8
/100
|
#211
Poor
29.8%
Nicaraguans
12.4
/100
|
#212
Poor
29.8%
Immigrants | Thailand
12.0
/100
|
#213
Poor
29.9%
Liberians
11.7
/100
|
#214
Poor
29.9%
Jamaicans
11.7
/100
|
#215
Poor
29.9%
Immigrants | Western Africa
11.5
/100
|
#216
Poor
29.9%
Immigrants | Ghana
11.3
/100
|
#217
Poor
29.9%
Hungarians
10.3
/100
|
#218
Poor
29.9%

Demographics Similar to Samoans by Single Mother Poverty

In terms of single mother poverty, the demographic groups most similar to Samoans are Immigrants from Colombia (28.5%, a difference of 0.010%), Immigrants from Belgium (28.5%, a difference of 0.050%), Native Hawaiian (28.4%, a difference of 0.10%), Immigrants from Canada (28.4%, a difference of 0.10%), and Danish (28.5%, a difference of 0.11%).
DemographicsRating | RankSingle Mother Poverty
Immigrants | Morocco
89.5
/100
|
#132
Excellent
28.4%
Swedes
89.4
/100
|
#133
Excellent
28.4%
Immigrants | Southern Europe
89.2
/100
|
#134
Excellent
28.4%
Immigrants | Spain
89.2
/100
|
#135
Excellent
28.4%
Native Hawaiians
88.9
/100
|
#136
Excellent
28.4%
Immigrants | Canada
88.9
/100
|
#137
Excellent
28.4%
Immigrants | Belgium
88.5
/100
|
#138
Excellent
28.5%
Samoans
88.1
/100
|
#139
Excellent
28.5%
Immigrants | Colombia
88.0
/100
|
#140
Excellent
28.5%
Danes
87.1
/100
|
#141
Excellent
28.5%
South Africans
86.6
/100
|
#142
Excellent
28.5%
Immigrants | North America
86.5
/100
|
#143
Excellent
28.5%
Luxembourgers
86.4
/100
|
#144
Excellent
28.5%
Immigrants | South America
86.1
/100
|
#145
Excellent
28.5%
Immigrants | Denmark
86.1
/100
|
#146
Excellent
28.5%