British vs Ecuadorian Single Mother Poverty
COMPARE
British
Ecuadorian
Single Mother Poverty
Single Mother Poverty Comparison
British
Ecuadorians
29.2%
SINGLE MOTHER POVERTY
50.6/ 100
METRIC RATING
173rd/ 347
METRIC RANK
30.8%
SINGLE MOTHER POVERTY
0.9/ 100
METRIC RATING
246th/ 347
METRIC RANK
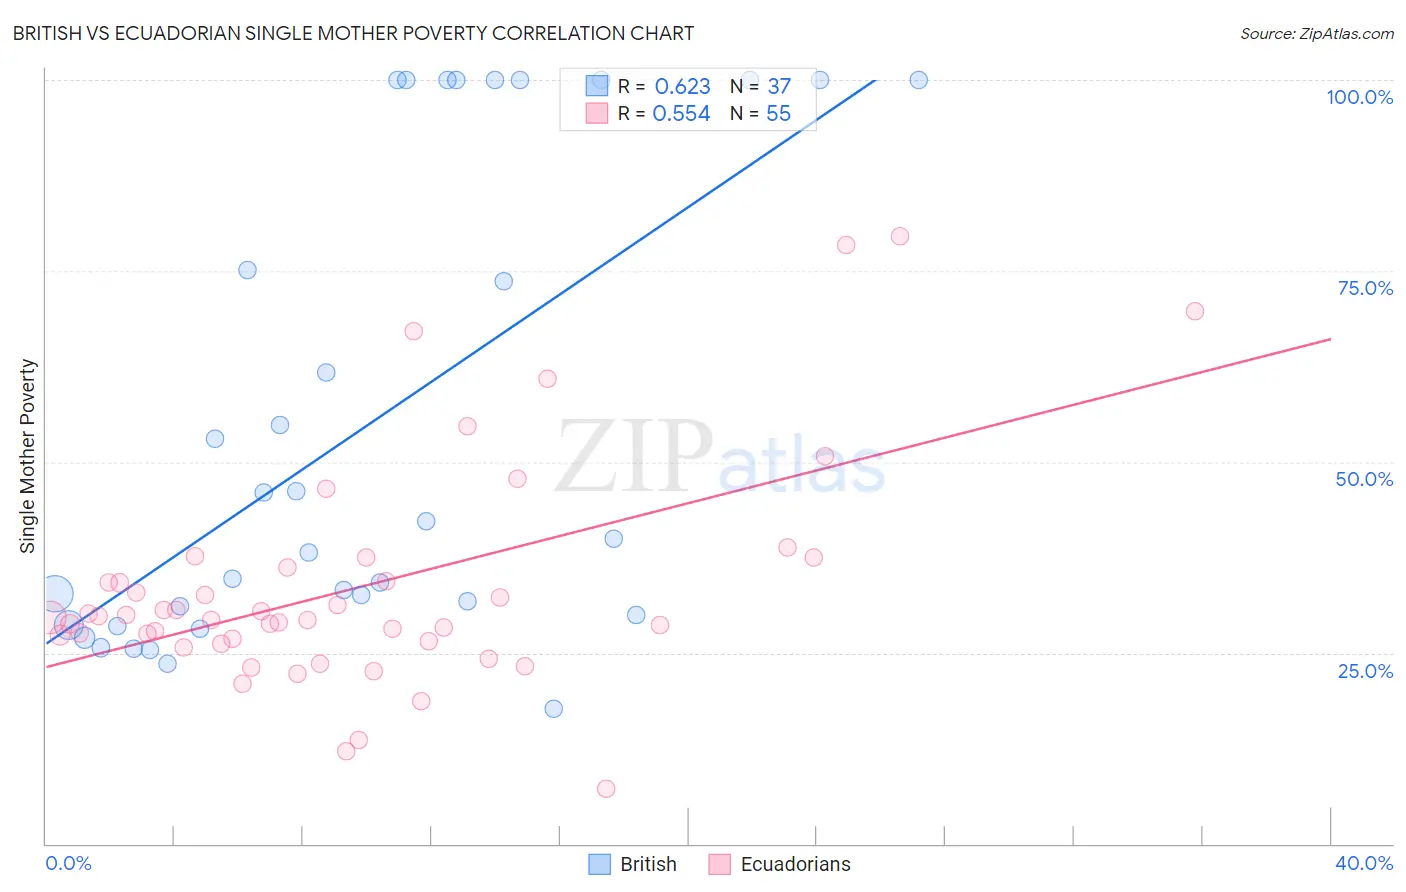
British vs Ecuadorian Single Mother Poverty Correlation Chart
The statistical analysis conducted on geographies consisting of 510,068,418 people shows a significant positive correlation between the proportion of British and poverty level among single mothers in the United States with a correlation coefficient (R) of 0.623 and weighted average of 29.2%. Similarly, the statistical analysis conducted on geographies consisting of 311,375,048 people shows a substantial positive correlation between the proportion of Ecuadorians and poverty level among single mothers in the United States with a correlation coefficient (R) of 0.554 and weighted average of 30.8%, a difference of 5.6%.
Single Mother Poverty Correlation Summary
| Measurement | British | Ecuadorian |
| Minimum | 17.7% | 7.3% |
| Maximum | 100.0% | 79.6% |
| Range | 82.3% | 72.3% |
| Mean | 54.6% | 33.5% |
| Median | 40.0% | 29.6% |
| Interquartile 25% (IQ1) | 29.4% | 26.5% |
| Interquartile 75% (IQ3) | 100.0% | 36.2% |
| Interquartile Range (IQR) | 70.6% | 9.8% |
| Standard Deviation (Sample) | 30.6% | 14.7% |
| Standard Deviation (Population) | 30.2% | 14.6% |
Similar Demographics by Single Mother Poverty
Demographics Similar to British by Single Mother Poverty
In terms of single mother poverty, the demographic groups most similar to British are Immigrants from Saudi Arabia (29.2%, a difference of 0.030%), Immigrants from Costa Rica (29.2%, a difference of 0.090%), Hawaiian (29.2%, a difference of 0.13%), Carpatho Rusyn (29.1%, a difference of 0.16%), and New Zealander (29.1%, a difference of 0.22%).
| Demographics | Rating | Rank | Single Mother Poverty |
| Inupiat | 60.4 /100 | #166 | Good 29.0% |
| Costa Ricans | 58.4 /100 | #167 | Average 29.0% |
| Europeans | 57.6 /100 | #168 | Average 29.1% |
| Immigrants | Uruguay | 57.2 /100 | #169 | Average 29.1% |
| New Zealanders | 55.1 /100 | #170 | Average 29.1% |
| Puget Sound Salish | 55.1 /100 | #171 | Average 29.1% |
| Carpatho Rusyns | 53.8 /100 | #172 | Average 29.1% |
| British | 50.6 /100 | #173 | Average 29.2% |
| Immigrants | Saudi Arabia | 50.0 /100 | #174 | Average 29.2% |
| Immigrants | Costa Rica | 48.8 /100 | #175 | Average 29.2% |
| Hawaiians | 47.8 /100 | #176 | Average 29.2% |
| Immigrants | Bosnia and Herzegovina | 45.1 /100 | #177 | Average 29.2% |
| South American Indians | 43.2 /100 | #178 | Average 29.3% |
| Immigrants | Uzbekistan | 42.6 /100 | #179 | Average 29.3% |
| Immigrants | Norway | 41.5 /100 | #180 | Average 29.3% |
Demographics Similar to Ecuadorians by Single Mother Poverty
In terms of single mother poverty, the demographic groups most similar to Ecuadorians are West Indian (30.8%, a difference of 0.040%), French Canadian (30.8%, a difference of 0.080%), Cape Verdean (30.8%, a difference of 0.15%), Vietnamese (30.9%, a difference of 0.30%), and Barbadian (30.7%, a difference of 0.40%).
| Demographics | Rating | Rank | Single Mother Poverty |
| Immigrants | Portugal | 2.1 /100 | #239 | Tragic 30.5% |
| Salvadorans | 1.8 /100 | #240 | Tragic 30.6% |
| Immigrants | Laos | 1.8 /100 | #241 | Tragic 30.6% |
| Immigrants | Burma/Myanmar | 1.7 /100 | #242 | Tragic 30.6% |
| Bermudans | 1.6 /100 | #243 | Tragic 30.6% |
| French | 1.3 /100 | #244 | Tragic 30.7% |
| Barbadians | 1.3 /100 | #245 | Tragic 30.7% |
| Ecuadorians | 0.9 /100 | #246 | Tragic 30.8% |
| West Indians | 0.9 /100 | #247 | Tragic 30.8% |
| French Canadians | 0.9 /100 | #248 | Tragic 30.8% |
| Cape Verdeans | 0.8 /100 | #249 | Tragic 30.8% |
| Vietnamese | 0.7 /100 | #250 | Tragic 30.9% |
| Tlingit-Haida | 0.6 /100 | #251 | Tragic 30.9% |
| Alaska Natives | 0.6 /100 | #252 | Tragic 30.9% |
| Celtics | 0.6 /100 | #253 | Tragic 30.9% |