Guamanian/Chamorro vs White/Caucasian Seniors Poverty Over the Age of 75
COMPARE
Guamanian/Chamorro
White/Caucasian
Seniors Poverty Over the Age of 75
Seniors Poverty Over the Age of 75 Comparison
Guamanians/Chamorros
Whites/Caucasians
11.6%
SENIORS POVERTY OVER THE AGE OF 75
90.6/ 100
METRIC RATING
102nd/ 347
METRIC RANK
11.4%
SENIORS POVERTY OVER THE AGE OF 75
95.5/ 100
METRIC RATING
77th/ 347
METRIC RANK
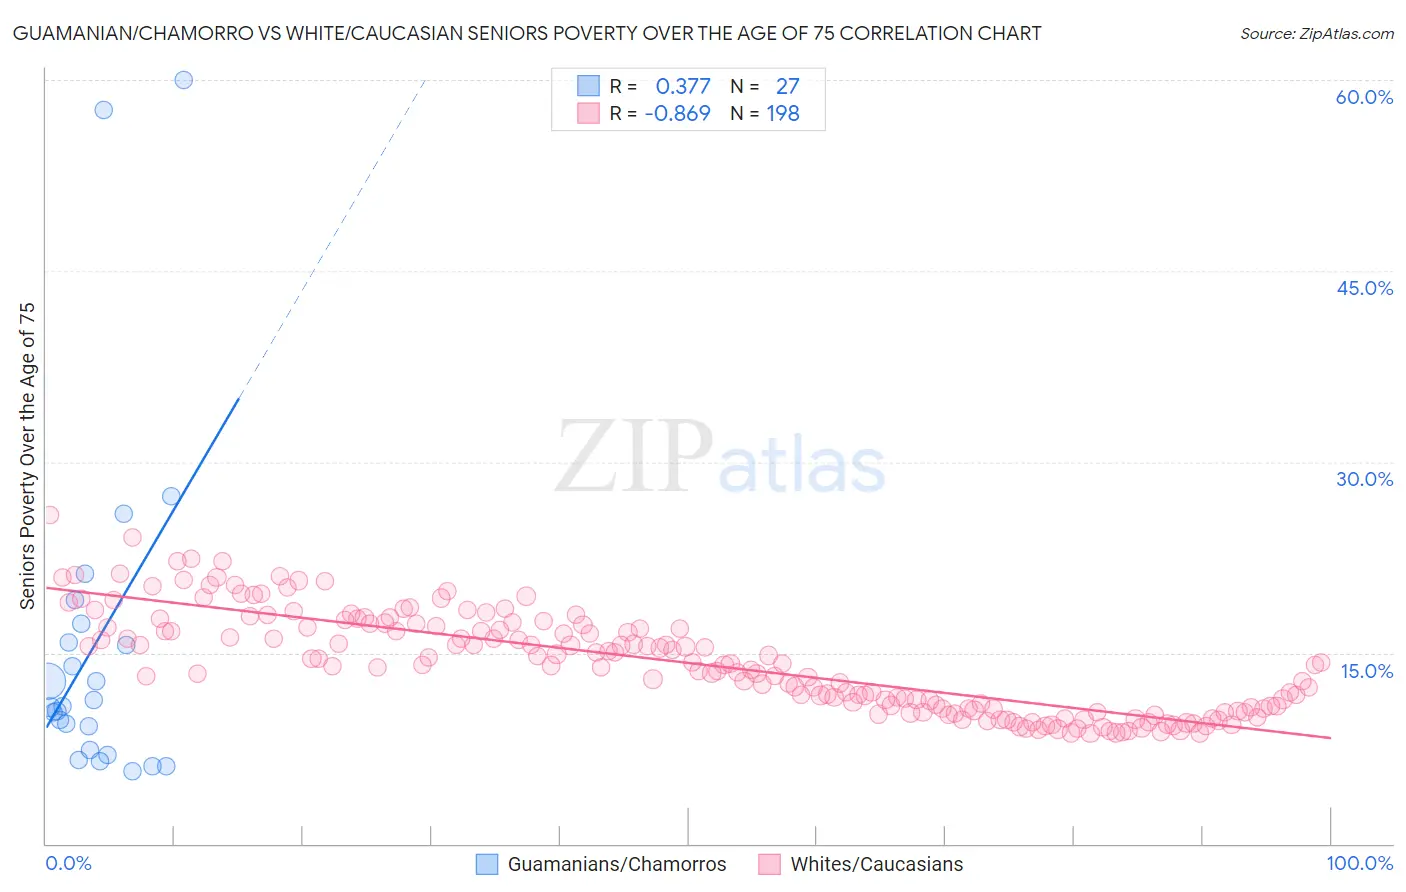
Guamanian/Chamorro vs White/Caucasian Seniors Poverty Over the Age of 75 Correlation Chart
The statistical analysis conducted on geographies consisting of 220,212,550 people shows a mild positive correlation between the proportion of Guamanians/Chamorros and poverty level among seniors over the age of 75 in the United States with a correlation coefficient (R) of 0.377 and weighted average of 11.6%. Similarly, the statistical analysis conducted on geographies consisting of 563,847,839 people shows a very strong negative correlation between the proportion of Whites/Caucasians and poverty level among seniors over the age of 75 in the United States with a correlation coefficient (R) of -0.869 and weighted average of 11.4%, a difference of 1.7%.
Seniors Poverty Over the Age of 75 Correlation Summary
| Measurement | Guamanian/Chamorro | White/Caucasian |
| Minimum | 5.7% | 8.6% |
| Maximum | 60.0% | 25.8% |
| Range | 54.3% | 17.1% |
| Mean | 15.8% | 14.2% |
| Median | 10.8% | 14.0% |
| Interquartile 25% (IQ1) | 7.4% | 10.6% |
| Interquartile 75% (IQ3) | 17.3% | 17.1% |
| Interquartile Range (IQR) | 9.9% | 6.5% |
| Standard Deviation (Sample) | 13.7% | 3.9% |
| Standard Deviation (Population) | 13.4% | 3.9% |
Similar Demographics by Seniors Poverty Over the Age of 75
Demographics Similar to Guamanians/Chamorros by Seniors Poverty Over the Age of 75
In terms of seniors poverty over the age of 75, the demographic groups most similar to Guamanians/Chamorros are Jordanian (11.6%, a difference of 0.040%), Immigrants from Kuwait (11.6%, a difference of 0.040%), Immigrants from Singapore (11.6%, a difference of 0.090%), Chickasaw (11.6%, a difference of 0.10%), and Syrian (11.6%, a difference of 0.12%).
| Demographics | Rating | Rank | Seniors Poverty Over the Age of 75 |
| Immigrants | Bosnia and Herzegovina | 92.6 /100 | #95 | Exceptional 11.6% |
| Immigrants | Sweden | 92.6 /100 | #96 | Exceptional 11.6% |
| Romanians | 92.3 /100 | #97 | Exceptional 11.6% |
| Immigrants | Japan | 91.9 /100 | #98 | Exceptional 11.6% |
| Immigrants | Ethiopia | 91.7 /100 | #99 | Exceptional 11.6% |
| Syrians | 91.1 /100 | #100 | Exceptional 11.6% |
| Jordanians | 90.8 /100 | #101 | Exceptional 11.6% |
| Guamanians/Chamorros | 90.6 /100 | #102 | Exceptional 11.6% |
| Immigrants | Kuwait | 90.5 /100 | #103 | Exceptional 11.6% |
| Immigrants | Singapore | 90.3 /100 | #104 | Exceptional 11.6% |
| Chickasaw | 90.2 /100 | #105 | Exceptional 11.6% |
| Russians | 89.9 /100 | #106 | Excellent 11.6% |
| Immigrants | Oceania | 89.4 /100 | #107 | Excellent 11.7% |
| Turks | 89.4 /100 | #108 | Excellent 11.7% |
| South Africans | 89.3 /100 | #109 | Excellent 11.7% |
Demographics Similar to Whites/Caucasians by Seniors Poverty Over the Age of 75
In terms of seniors poverty over the age of 75, the demographic groups most similar to Whites/Caucasians are Macedonian (11.4%, a difference of 0.010%), Filipino (11.4%, a difference of 0.020%), Alaska Native (11.4%, a difference of 0.070%), French Canadian (11.4%, a difference of 0.080%), and Palestinian (11.4%, a difference of 0.15%).
| Demographics | Rating | Rank | Seniors Poverty Over the Age of 75 |
| Immigrants | South Central Asia | 96.4 /100 | #70 | Exceptional 11.4% |
| Osage | 96.3 /100 | #71 | Exceptional 11.4% |
| Sierra Leoneans | 96.1 /100 | #72 | Exceptional 11.4% |
| Immigrants | Micronesia | 96.0 /100 | #73 | Exceptional 11.4% |
| Delaware | 96.0 /100 | #74 | Exceptional 11.4% |
| Palestinians | 95.8 /100 | #75 | Exceptional 11.4% |
| French Canadians | 95.7 /100 | #76 | Exceptional 11.4% |
| Whites/Caucasians | 95.5 /100 | #77 | Exceptional 11.4% |
| Macedonians | 95.5 /100 | #78 | Exceptional 11.4% |
| Filipinos | 95.5 /100 | #79 | Exceptional 11.4% |
| Alaska Natives | 95.4 /100 | #80 | Exceptional 11.4% |
| Basques | 95.1 /100 | #81 | Exceptional 11.5% |
| Iranians | 95.1 /100 | #82 | Exceptional 11.5% |
| Immigrants | South Africa | 94.9 /100 | #83 | Exceptional 11.5% |
| Immigrants | Iraq | 94.9 /100 | #84 | Exceptional 11.5% |