Guamanian/Chamorro vs Immigrants from Iran Seniors Poverty Over the Age of 75
COMPARE
Guamanian/Chamorro
Immigrants from Iran
Seniors Poverty Over the Age of 75
Seniors Poverty Over the Age of 75 Comparison
Guamanians/Chamorros
Immigrants from Iran
11.6%
SENIORS POVERTY OVER THE AGE OF 75
90.6/ 100
METRIC RATING
102nd/ 347
METRIC RANK
12.2%
SENIORS POVERTY OVER THE AGE OF 75
48.1/ 100
METRIC RATING
176th/ 347
METRIC RANK
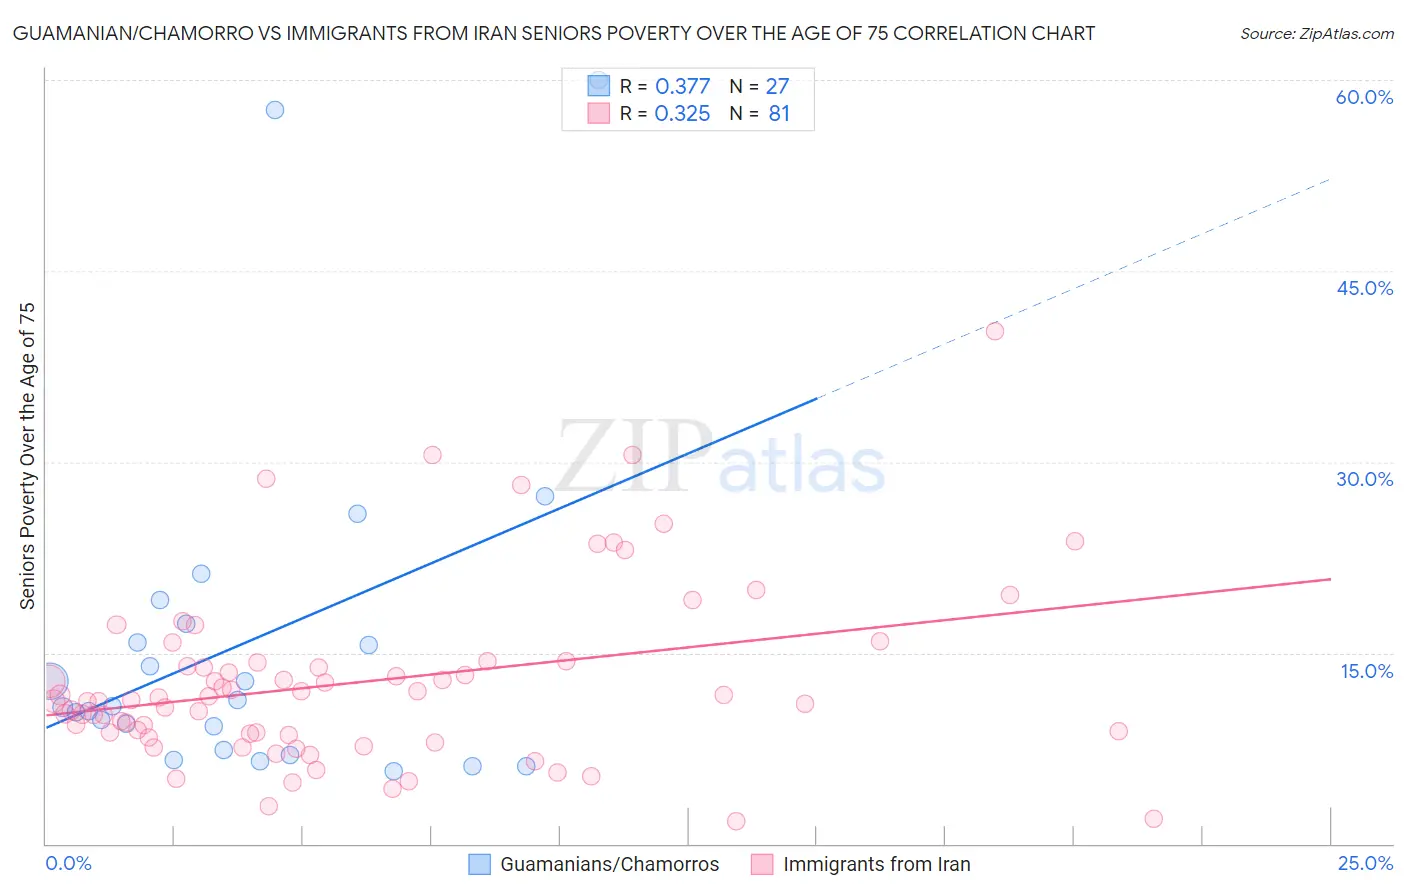
Guamanian/Chamorro vs Immigrants from Iran Seniors Poverty Over the Age of 75 Correlation Chart
The statistical analysis conducted on geographies consisting of 220,212,550 people shows a mild positive correlation between the proportion of Guamanians/Chamorros and poverty level among seniors over the age of 75 in the United States with a correlation coefficient (R) of 0.377 and weighted average of 11.6%. Similarly, the statistical analysis conducted on geographies consisting of 277,768,915 people shows a mild positive correlation between the proportion of Immigrants from Iran and poverty level among seniors over the age of 75 in the United States with a correlation coefficient (R) of 0.325 and weighted average of 12.2%, a difference of 5.0%.
Seniors Poverty Over the Age of 75 Correlation Summary
| Measurement | Guamanian/Chamorro | Immigrants from Iran |
| Minimum | 5.7% | 1.7% |
| Maximum | 60.0% | 40.3% |
| Range | 54.3% | 38.6% |
| Mean | 15.8% | 12.7% |
| Median | 10.8% | 11.3% |
| Interquartile 25% (IQ1) | 7.4% | 8.6% |
| Interquartile 75% (IQ3) | 17.3% | 14.3% |
| Interquartile Range (IQR) | 9.9% | 5.7% |
| Standard Deviation (Sample) | 13.7% | 7.0% |
| Standard Deviation (Population) | 13.4% | 7.0% |
Similar Demographics by Seniors Poverty Over the Age of 75
Demographics Similar to Guamanians/Chamorros by Seniors Poverty Over the Age of 75
In terms of seniors poverty over the age of 75, the demographic groups most similar to Guamanians/Chamorros are Jordanian (11.6%, a difference of 0.040%), Immigrants from Kuwait (11.6%, a difference of 0.040%), Immigrants from Singapore (11.6%, a difference of 0.090%), Chickasaw (11.6%, a difference of 0.10%), and Syrian (11.6%, a difference of 0.12%).
| Demographics | Rating | Rank | Seniors Poverty Over the Age of 75 |
| Immigrants | Bosnia and Herzegovina | 92.6 /100 | #95 | Exceptional 11.6% |
| Immigrants | Sweden | 92.6 /100 | #96 | Exceptional 11.6% |
| Romanians | 92.3 /100 | #97 | Exceptional 11.6% |
| Immigrants | Japan | 91.9 /100 | #98 | Exceptional 11.6% |
| Immigrants | Ethiopia | 91.7 /100 | #99 | Exceptional 11.6% |
| Syrians | 91.1 /100 | #100 | Exceptional 11.6% |
| Jordanians | 90.8 /100 | #101 | Exceptional 11.6% |
| Guamanians/Chamorros | 90.6 /100 | #102 | Exceptional 11.6% |
| Immigrants | Kuwait | 90.5 /100 | #103 | Exceptional 11.6% |
| Immigrants | Singapore | 90.3 /100 | #104 | Exceptional 11.6% |
| Chickasaw | 90.2 /100 | #105 | Exceptional 11.6% |
| Russians | 89.9 /100 | #106 | Excellent 11.6% |
| Immigrants | Oceania | 89.4 /100 | #107 | Excellent 11.7% |
| Turks | 89.4 /100 | #108 | Excellent 11.7% |
| South Africans | 89.3 /100 | #109 | Excellent 11.7% |
Demographics Similar to Immigrants from Iran by Seniors Poverty Over the Age of 75
In terms of seniors poverty over the age of 75, the demographic groups most similar to Immigrants from Iran are Immigrants from Asia (12.2%, a difference of 0.020%), Nonimmigrants (12.2%, a difference of 0.10%), Immigrants from Saudi Arabia (12.2%, a difference of 0.11%), Immigrants from Europe (12.2%, a difference of 0.16%), and Arab (12.2%, a difference of 0.19%).
| Demographics | Rating | Rank | Seniors Poverty Over the Age of 75 |
| Immigrants | Egypt | 53.7 /100 | #169 | Average 12.2% |
| Immigrants | Thailand | 52.0 /100 | #170 | Average 12.2% |
| Spaniards | 51.6 /100 | #171 | Average 12.2% |
| Immigrants | Fiji | 51.5 /100 | #172 | Average 12.2% |
| Arabs | 50.5 /100 | #173 | Average 12.2% |
| Immigrants | Europe | 50.0 /100 | #174 | Average 12.2% |
| Immigrants | Saudi Arabia | 49.5 /100 | #175 | Average 12.2% |
| Immigrants | Iran | 48.1 /100 | #176 | Average 12.2% |
| Immigrants | Asia | 47.8 /100 | #177 | Average 12.2% |
| Immigrants | Nonimmigrants | 46.8 /100 | #178 | Average 12.2% |
| Mongolians | 45.5 /100 | #179 | Average 12.2% |
| Immigrants | South Eastern Asia | 44.3 /100 | #180 | Average 12.2% |
| Immigrants | Australia | 44.2 /100 | #181 | Average 12.2% |
| German Russians | 41.4 /100 | #182 | Average 12.3% |
| Laotians | 38.2 /100 | #183 | Fair 12.3% |