Guamanian/Chamorro vs White/Caucasian Unemployment Among Ages 20 to 24 years
COMPARE
Guamanian/Chamorro
White/Caucasian
Unemployment Among Ages 20 to 24 years
Unemployment Among Ages 20 to 24 years Comparison
Guamanians/Chamorros
Whites/Caucasians
10.4%
UNEMPLOYMENT AMONG AGES 20 TO 24 YEARS
35.4/ 100
METRIC RATING
186th/ 347
METRIC RANK
10.1%
UNEMPLOYMENT AMONG AGES 20 TO 24 YEARS
87.4/ 100
METRIC RATING
122nd/ 347
METRIC RANK
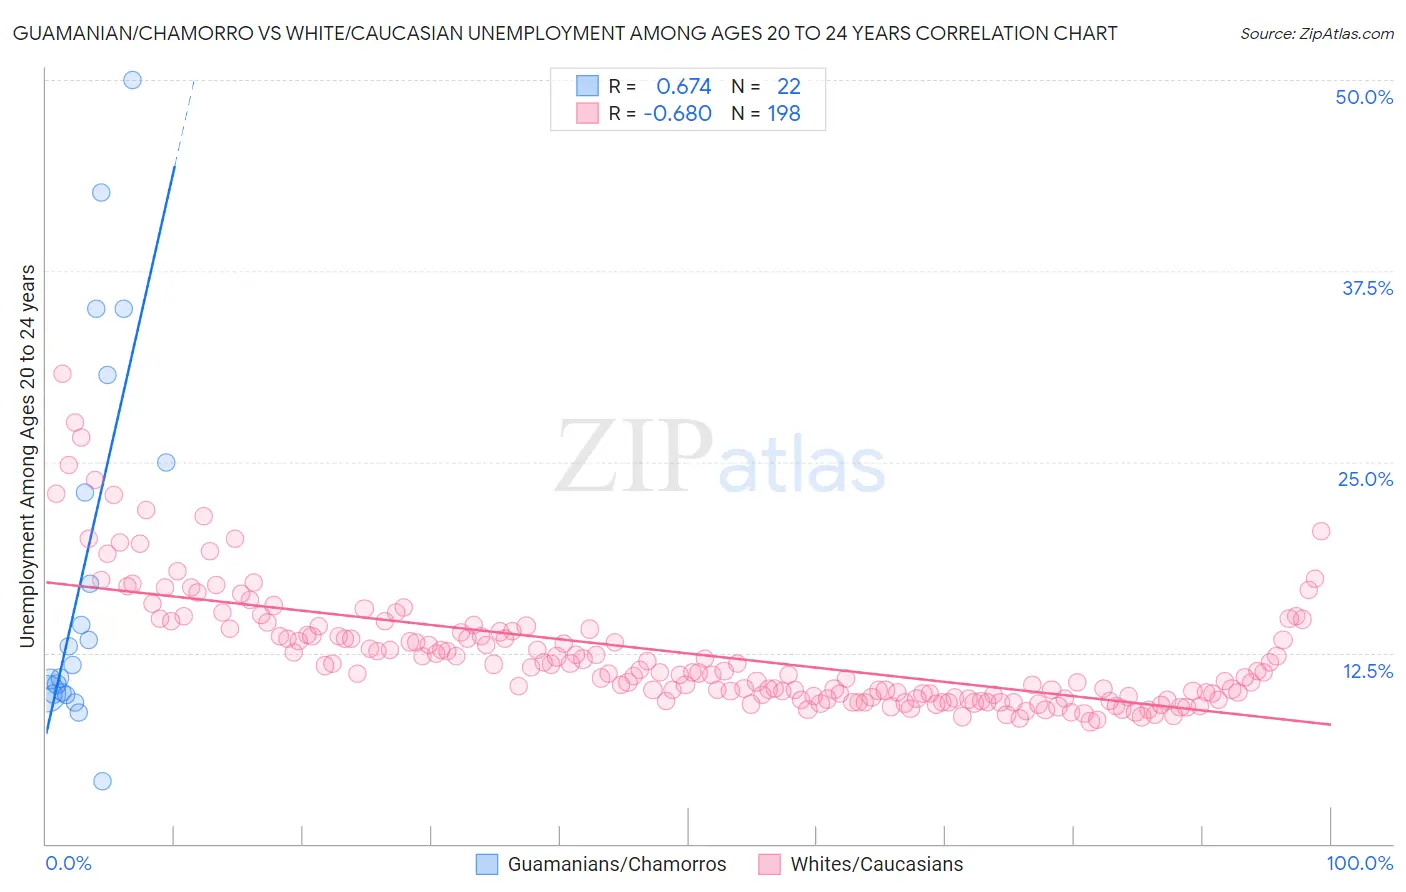
Guamanian/Chamorro vs White/Caucasian Unemployment Among Ages 20 to 24 years Correlation Chart
The statistical analysis conducted on geographies consisting of 219,033,471 people shows a significant positive correlation between the proportion of Guamanians/Chamorros and unemployment rate among population between the ages 20 and 24 in the United States with a correlation coefficient (R) of 0.674 and weighted average of 10.4%. Similarly, the statistical analysis conducted on geographies consisting of 530,440,022 people shows a significant negative correlation between the proportion of Whites/Caucasians and unemployment rate among population between the ages 20 and 24 in the United States with a correlation coefficient (R) of -0.680 and weighted average of 10.1%, a difference of 2.4%.
Unemployment Among Ages 20 to 24 years Correlation Summary
| Measurement | Guamanian/Chamorro | White/Caucasian |
| Minimum | 4.1% | 8.0% |
| Maximum | 50.0% | 30.8% |
| Range | 45.9% | 22.8% |
| Mean | 18.4% | 12.5% |
| Median | 12.3% | 11.3% |
| Interquartile 25% (IQ1) | 9.9% | 9.6% |
| Interquartile 75% (IQ3) | 25.0% | 13.9% |
| Interquartile Range (IQR) | 15.1% | 4.3% |
| Standard Deviation (Sample) | 12.6% | 3.9% |
| Standard Deviation (Population) | 12.3% | 3.9% |
Similar Demographics by Unemployment Among Ages 20 to 24 years
Demographics Similar to Guamanians/Chamorros by Unemployment Among Ages 20 to 24 years
In terms of unemployment among ages 20 to 24 years, the demographic groups most similar to Guamanians/Chamorros are Syrian (10.4%, a difference of 0.010%), Immigrants from Western Europe (10.4%, a difference of 0.020%), Immigrants from Russia (10.4%, a difference of 0.030%), Hawaiian (10.4%, a difference of 0.060%), and Greek (10.4%, a difference of 0.070%).
| Demographics | Rating | Rank | Unemployment Among Ages 20 to 24 years |
| Tlingit-Haida | 39.7 /100 | #179 | Fair 10.3% |
| Immigrants | Turkey | 39.3 /100 | #180 | Fair 10.3% |
| Okinawans | 39.1 /100 | #181 | Fair 10.3% |
| Immigrants | Germany | 38.1 /100 | #182 | Fair 10.4% |
| Immigrants | Egypt | 37.4 /100 | #183 | Fair 10.4% |
| Greeks | 37.2 /100 | #184 | Fair 10.4% |
| Syrians | 35.6 /100 | #185 | Fair 10.4% |
| Guamanians/Chamorros | 35.4 /100 | #186 | Fair 10.4% |
| Immigrants | Western Europe | 35.0 /100 | #187 | Fair 10.4% |
| Immigrants | Russia | 34.6 /100 | #188 | Fair 10.4% |
| Hawaiians | 33.9 /100 | #189 | Fair 10.4% |
| Immigrants | China | 32.6 /100 | #190 | Fair 10.4% |
| Immigrants | Eastern Europe | 25.8 /100 | #191 | Fair 10.4% |
| Ugandans | 25.7 /100 | #192 | Fair 10.4% |
| Immigrants | Portugal | 25.3 /100 | #193 | Fair 10.4% |
Demographics Similar to Whites/Caucasians by Unemployment Among Ages 20 to 24 years
In terms of unemployment among ages 20 to 24 years, the demographic groups most similar to Whites/Caucasians are Immigrants from Iraq (10.1%, a difference of 0.020%), South African (10.1%, a difference of 0.040%), Immigrants from Canada (10.1%, a difference of 0.070%), Immigrants from Japan (10.1%, a difference of 0.070%), and French (10.1%, a difference of 0.080%).
| Demographics | Rating | Rank | Unemployment Among Ages 20 to 24 years |
| Immigrants | Morocco | 90.5 /100 | #115 | Exceptional 10.1% |
| Basques | 89.8 /100 | #116 | Excellent 10.1% |
| Immigrants | Uruguay | 89.6 /100 | #117 | Excellent 10.1% |
| Paraguayans | 88.6 /100 | #118 | Excellent 10.1% |
| French | 88.2 /100 | #119 | Excellent 10.1% |
| Immigrants | Canada | 88.2 /100 | #120 | Excellent 10.1% |
| South Africans | 87.8 /100 | #121 | Excellent 10.1% |
| Whites/Caucasians | 87.4 /100 | #122 | Excellent 10.1% |
| Immigrants | Iraq | 87.1 /100 | #123 | Excellent 10.1% |
| Immigrants | Japan | 86.5 /100 | #124 | Excellent 10.1% |
| Spanish | 86.1 /100 | #125 | Excellent 10.1% |
| Jordanians | 86.1 /100 | #126 | Excellent 10.1% |
| Immigrants | Norway | 85.3 /100 | #127 | Excellent 10.1% |
| Immigrants | Brazil | 84.9 /100 | #128 | Excellent 10.1% |
| Immigrants | South Central Asia | 84.6 /100 | #129 | Excellent 10.1% |