Guamanian/Chamorro vs Immigrants from Burma/Myanmar Child Poverty Among Girls Under 16
COMPARE
Guamanian/Chamorro
Immigrants from Burma/Myanmar
Child Poverty Among Girls Under 16
Child Poverty Among Girls Under 16 Comparison
Guamanians/Chamorros
Immigrants from Burma/Myanmar
15.9%
CHILD POVERTY AMONG GIRLS UNDER 16
75.3/ 100
METRIC RATING
158th/ 347
METRIC RANK
19.7%
CHILD POVERTY AMONG GIRLS UNDER 16
0.1/ 100
METRIC RATING
263rd/ 347
METRIC RANK
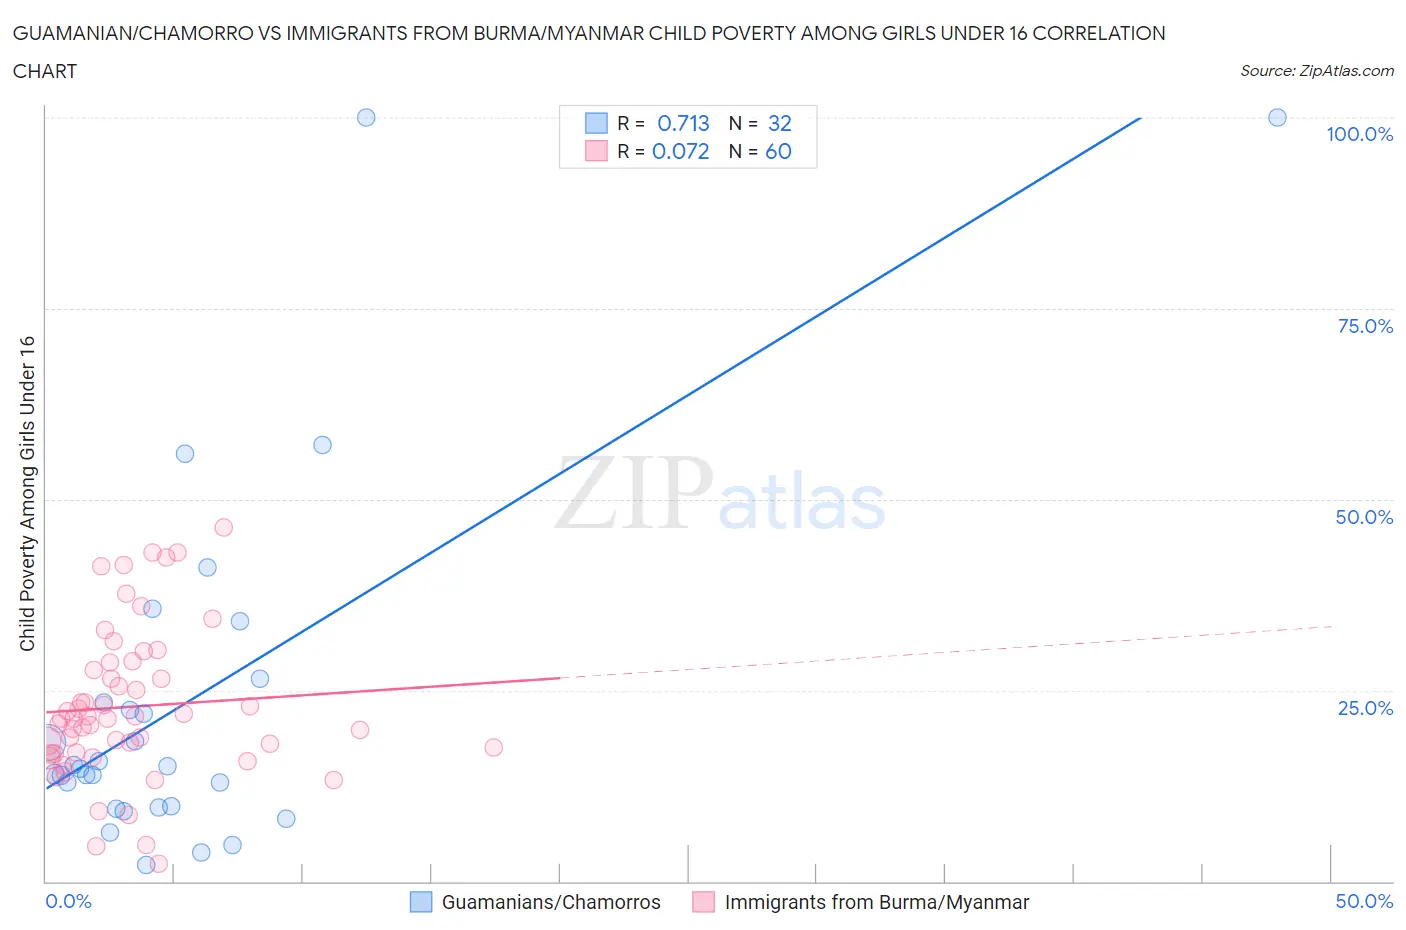
Guamanian/Chamorro vs Immigrants from Burma/Myanmar Child Poverty Among Girls Under 16 Correlation Chart
The statistical analysis conducted on geographies consisting of 220,387,643 people shows a strong positive correlation between the proportion of Guamanians/Chamorros and poverty level among girls under the age of 16 in the United States with a correlation coefficient (R) of 0.713 and weighted average of 15.9%. Similarly, the statistical analysis conducted on geographies consisting of 171,314,944 people shows a slight positive correlation between the proportion of Immigrants from Burma/Myanmar and poverty level among girls under the age of 16 in the United States with a correlation coefficient (R) of 0.072 and weighted average of 19.7%, a difference of 23.3%.
Child Poverty Among Girls Under 16 Correlation Summary
| Measurement | Guamanian/Chamorro | Immigrants from Burma/Myanmar |
| Minimum | 2.0% | 2.4% |
| Maximum | 100.0% | 46.4% |
| Range | 98.0% | 44.0% |
| Mean | 23.8% | 22.9% |
| Median | 14.9% | 21.3% |
| Interquartile 25% (IQ1) | 9.7% | 16.8% |
| Interquartile 75% (IQ3) | 24.9% | 28.2% |
| Interquartile Range (IQR) | 15.2% | 11.3% |
| Standard Deviation (Sample) | 24.0% | 9.8% |
| Standard Deviation (Population) | 23.7% | 9.7% |
Similar Demographics by Child Poverty Among Girls Under 16
Demographics Similar to Guamanians/Chamorros by Child Poverty Among Girls Under 16
In terms of child poverty among girls under 16, the demographic groups most similar to Guamanians/Chamorros are Slovak (15.9%, a difference of 0.010%), Immigrants from Fiji (15.9%, a difference of 0.12%), Colombian (15.9%, a difference of 0.12%), Syrian (15.9%, a difference of 0.22%), and Immigrants from Chile (15.9%, a difference of 0.23%).
| Demographics | Rating | Rank | Child Poverty Among Girls Under 16 |
| Venezuelans | 80.1 /100 | #151 | Excellent 15.8% |
| Immigrants | Kuwait | 79.4 /100 | #152 | Good 15.8% |
| Immigrants | Nepal | 78.5 /100 | #153 | Good 15.9% |
| Immigrants | Chile | 76.7 /100 | #154 | Good 15.9% |
| Syrians | 76.7 /100 | #155 | Good 15.9% |
| Immigrants | Fiji | 76.1 /100 | #156 | Good 15.9% |
| Colombians | 76.1 /100 | #157 | Good 15.9% |
| Guamanians/Chamorros | 75.3 /100 | #158 | Good 15.9% |
| Slovaks | 75.2 /100 | #159 | Good 15.9% |
| French | 72.8 /100 | #160 | Good 16.0% |
| Immigrants | Northern Africa | 72.0 /100 | #161 | Good 16.0% |
| French Canadians | 68.7 /100 | #162 | Good 16.1% |
| Immigrants | Oceania | 68.4 /100 | #163 | Good 16.1% |
| Immigrants | Colombia | 67.8 /100 | #164 | Good 16.1% |
| Immigrants | Germany | 67.3 /100 | #165 | Good 16.1% |
Demographics Similar to Immigrants from Burma/Myanmar by Child Poverty Among Girls Under 16
In terms of child poverty among girls under 16, the demographic groups most similar to Immigrants from Burma/Myanmar are Jamaican (19.7%, a difference of 0.11%), Chickasaw (19.6%, a difference of 0.12%), Immigrants from Jamaica (19.8%, a difference of 0.55%), Vietnamese (19.5%, a difference of 0.64%), and Mexican American Indian (19.5%, a difference of 0.73%).
| Demographics | Rating | Rank | Child Poverty Among Girls Under 16 |
| Trinidadians and Tobagonians | 0.2 /100 | #256 | Tragic 19.3% |
| Guyanese | 0.2 /100 | #257 | Tragic 19.4% |
| Salvadorans | 0.2 /100 | #258 | Tragic 19.4% |
| Ottawa | 0.2 /100 | #259 | Tragic 19.4% |
| Mexican American Indians | 0.2 /100 | #260 | Tragic 19.5% |
| Vietnamese | 0.2 /100 | #261 | Tragic 19.5% |
| Chickasaw | 0.1 /100 | #262 | Tragic 19.6% |
| Immigrants | Burma/Myanmar | 0.1 /100 | #263 | Tragic 19.7% |
| Jamaicans | 0.1 /100 | #264 | Tragic 19.7% |
| Immigrants | Jamaica | 0.1 /100 | #265 | Tragic 19.8% |
| Spanish Americans | 0.1 /100 | #266 | Tragic 19.8% |
| Immigrants | Bangladesh | 0.1 /100 | #267 | Tragic 19.9% |
| Spanish American Indians | 0.1 /100 | #268 | Tragic 19.9% |
| Liberians | 0.1 /100 | #269 | Tragic 19.9% |
| Cherokee | 0.1 /100 | #270 | Tragic 19.9% |