Guamanian/Chamorro vs Immigrants from Burma/Myanmar Child Poverty Among Boys Under 16
COMPARE
Guamanian/Chamorro
Immigrants from Burma/Myanmar
Child Poverty Among Boys Under 16
Child Poverty Among Boys Under 16 Comparison
Guamanians/Chamorros
Immigrants from Burma/Myanmar
16.1%
CHILD POVERTY AMONG BOYS UNDER 16
69.6/ 100
METRIC RATING
162nd/ 347
METRIC RANK
19.2%
CHILD POVERTY AMONG BOYS UNDER 16
0.2/ 100
METRIC RATING
250th/ 347
METRIC RANK
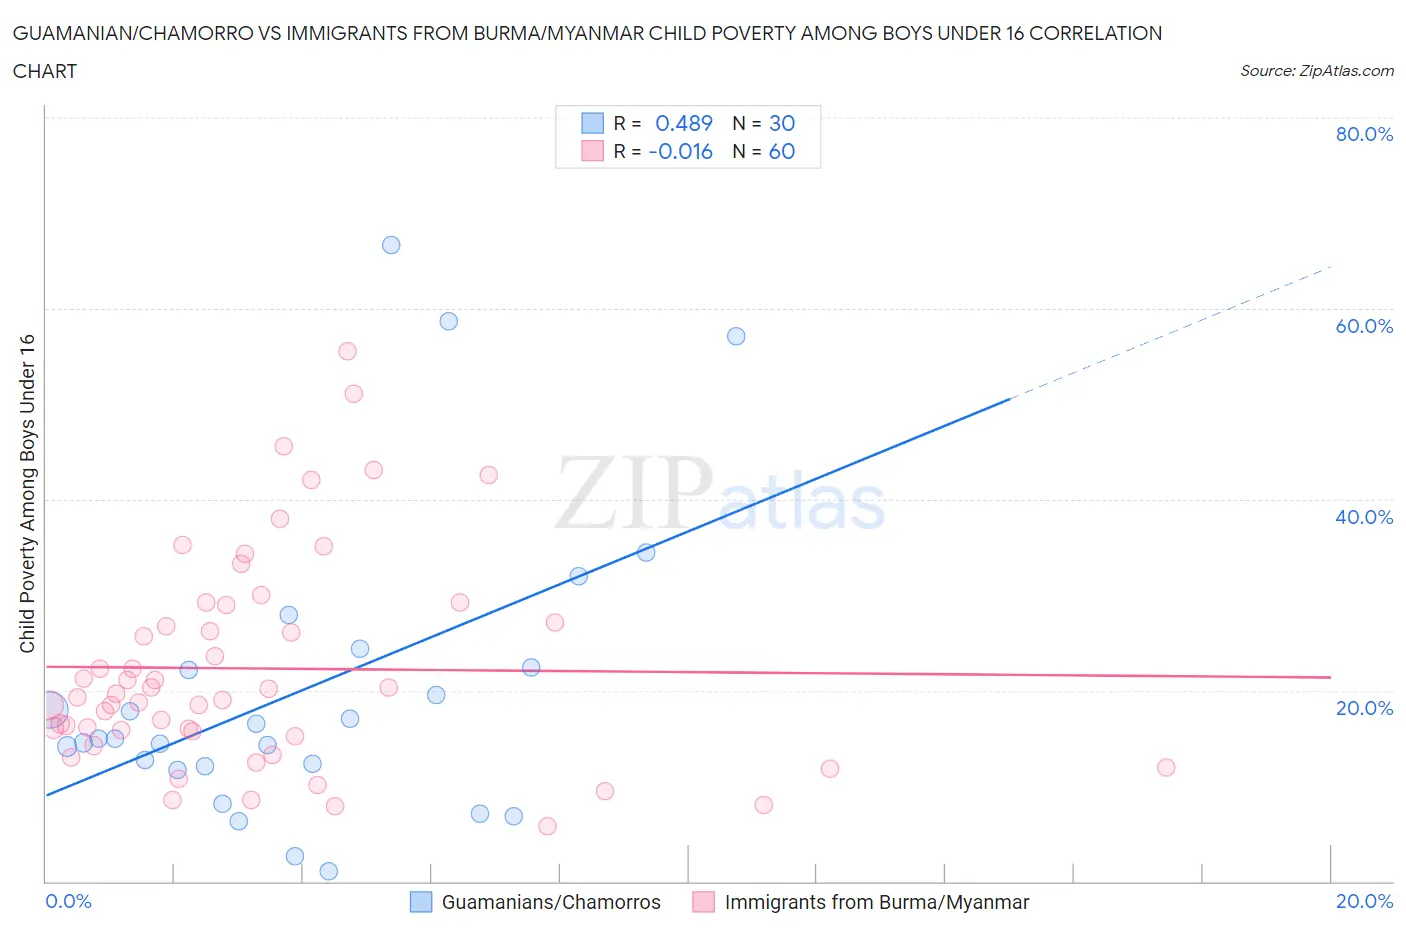
Guamanian/Chamorro vs Immigrants from Burma/Myanmar Child Poverty Among Boys Under 16 Correlation Chart
The statistical analysis conducted on geographies consisting of 220,488,068 people shows a moderate positive correlation between the proportion of Guamanians/Chamorros and poverty level among boys under the age of 16 in the United States with a correlation coefficient (R) of 0.489 and weighted average of 16.1%. Similarly, the statistical analysis conducted on geographies consisting of 171,312,053 people shows no correlation between the proportion of Immigrants from Burma/Myanmar and poverty level among boys under the age of 16 in the United States with a correlation coefficient (R) of -0.016 and weighted average of 19.2%, a difference of 19.7%.
Child Poverty Among Boys Under 16 Correlation Summary
| Measurement | Guamanian/Chamorro | Immigrants from Burma/Myanmar |
| Minimum | 1.0% | 5.8% |
| Maximum | 66.7% | 55.6% |
| Range | 65.6% | 49.8% |
| Mean | 20.1% | 22.3% |
| Median | 14.9% | 19.5% |
| Interquartile 25% (IQ1) | 12.0% | 15.4% |
| Interquartile 75% (IQ3) | 22.4% | 28.0% |
| Interquartile Range (IQR) | 10.3% | 12.6% |
| Standard Deviation (Sample) | 15.8% | 11.2% |
| Standard Deviation (Population) | 15.6% | 11.1% |
Similar Demographics by Child Poverty Among Boys Under 16
Demographics Similar to Guamanians/Chamorros by Child Poverty Among Boys Under 16
In terms of child poverty among boys under 16, the demographic groups most similar to Guamanians/Chamorros are Costa Rican (16.1%, a difference of 0.20%), Immigrants from Albania (16.1%, a difference of 0.22%), Immigrants from Oceania (16.0%, a difference of 0.23%), Immigrants from Northern Africa (16.0%, a difference of 0.24%), and Colombian (16.1%, a difference of 0.58%).
| Demographics | Rating | Rank | Child Poverty Among Boys Under 16 |
| French Canadians | 76.6 /100 | #155 | Good 15.9% |
| Israelis | 76.5 /100 | #156 | Good 15.9% |
| Immigrants | Nepal | 76.0 /100 | #157 | Good 15.9% |
| Yugoslavians | 75.9 /100 | #158 | Good 15.9% |
| Immigrants | Chile | 74.8 /100 | #159 | Good 15.9% |
| Immigrants | Northern Africa | 71.3 /100 | #160 | Good 16.0% |
| Immigrants | Oceania | 71.3 /100 | #161 | Good 16.0% |
| Guamanians/Chamorros | 69.6 /100 | #162 | Good 16.1% |
| Costa Ricans | 68.1 /100 | #163 | Good 16.1% |
| Immigrants | Albania | 67.9 /100 | #164 | Good 16.1% |
| Colombians | 65.2 /100 | #165 | Good 16.1% |
| Immigrants | Germany | 63.6 /100 | #166 | Good 16.2% |
| Afghans | 55.4 /100 | #167 | Average 16.3% |
| South Americans | 55.3 /100 | #168 | Average 16.3% |
| Immigrants | Saudi Arabia | 53.6 /100 | #169 | Average 16.4% |
Demographics Similar to Immigrants from Burma/Myanmar by Child Poverty Among Boys Under 16
In terms of child poverty among boys under 16, the demographic groups most similar to Immigrants from Burma/Myanmar are French American Indian (19.2%, a difference of 0.030%), Immigrants from Western Africa (19.3%, a difference of 0.26%), Liberian (19.3%, a difference of 0.33%), Trinidadian and Tobagonian (19.3%, a difference of 0.60%), and Ecuadorian (19.3%, a difference of 0.60%).
| Demographics | Rating | Rank | Child Poverty Among Boys Under 16 |
| Immigrants | Azores | 0.4 /100 | #243 | Tragic 18.9% |
| Immigrants | Middle Africa | 0.4 /100 | #244 | Tragic 18.9% |
| Cree | 0.4 /100 | #245 | Tragic 19.0% |
| Immigrants | Nicaragua | 0.4 /100 | #246 | Tragic 19.0% |
| Immigrants | Trinidad and Tobago | 0.3 /100 | #247 | Tragic 19.0% |
| Salvadorans | 0.3 /100 | #248 | Tragic 19.0% |
| Alsatians | 0.3 /100 | #249 | Tragic 19.1% |
| Immigrants | Burma/Myanmar | 0.2 /100 | #250 | Tragic 19.2% |
| French American Indians | 0.2 /100 | #251 | Tragic 19.2% |
| Immigrants | Western Africa | 0.2 /100 | #252 | Tragic 19.3% |
| Liberians | 0.2 /100 | #253 | Tragic 19.3% |
| Trinidadians and Tobagonians | 0.2 /100 | #254 | Tragic 19.3% |
| Ecuadorians | 0.2 /100 | #255 | Tragic 19.3% |
| Immigrants | Liberia | 0.2 /100 | #256 | Tragic 19.3% |
| Mexican American Indians | 0.2 /100 | #257 | Tragic 19.4% |