Marshallese vs Immigrants from Burma/Myanmar Child Poverty Among Boys Under 16
COMPARE
Marshallese
Immigrants from Burma/Myanmar
Child Poverty Among Boys Under 16
Child Poverty Among Boys Under 16 Comparison
Marshallese
Immigrants from Burma/Myanmar
18.4%
CHILD POVERTY AMONG BOYS UNDER 16
1.3/ 100
METRIC RATING
232nd/ 347
METRIC RANK
19.2%
CHILD POVERTY AMONG BOYS UNDER 16
0.2/ 100
METRIC RATING
250th/ 347
METRIC RANK
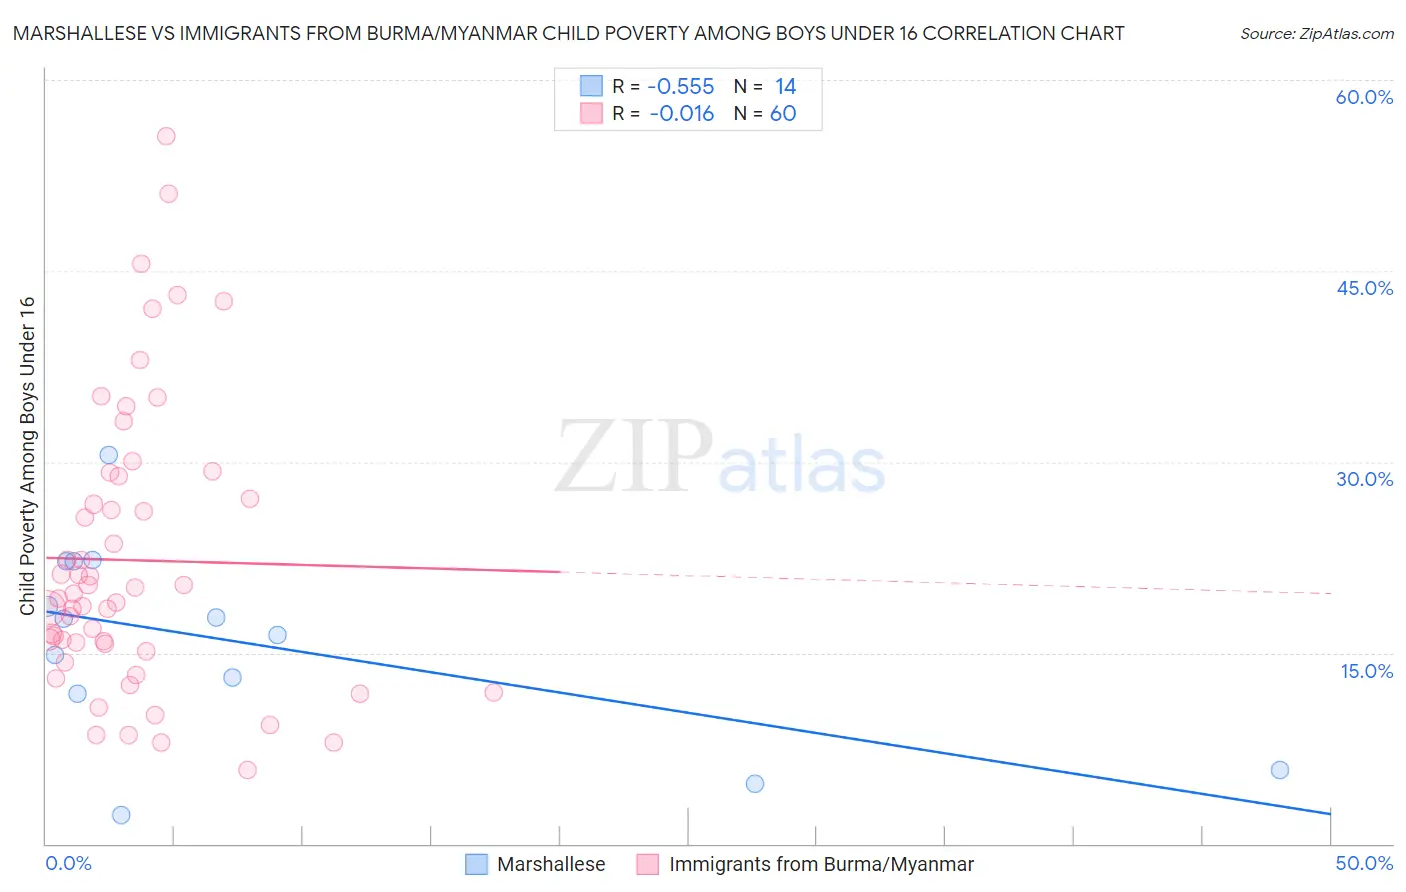
Marshallese vs Immigrants from Burma/Myanmar Child Poverty Among Boys Under 16 Correlation Chart
The statistical analysis conducted on geographies consisting of 14,730,412 people shows a substantial negative correlation between the proportion of Marshallese and poverty level among boys under the age of 16 in the United States with a correlation coefficient (R) of -0.555 and weighted average of 18.4%. Similarly, the statistical analysis conducted on geographies consisting of 171,312,053 people shows no correlation between the proportion of Immigrants from Burma/Myanmar and poverty level among boys under the age of 16 in the United States with a correlation coefficient (R) of -0.016 and weighted average of 19.2%, a difference of 4.4%.
Child Poverty Among Boys Under 16 Correlation Summary
| Measurement | Marshallese | Immigrants from Burma/Myanmar |
| Minimum | 2.3% | 5.8% |
| Maximum | 30.6% | 55.6% |
| Range | 28.3% | 49.8% |
| Mean | 15.7% | 22.3% |
| Median | 17.1% | 19.5% |
| Interquartile 25% (IQ1) | 11.8% | 15.4% |
| Interquartile 75% (IQ3) | 22.2% | 28.0% |
| Interquartile Range (IQR) | 10.3% | 12.6% |
| Standard Deviation (Sample) | 7.8% | 11.2% |
| Standard Deviation (Population) | 7.5% | 11.1% |
Demographics Similar to Marshallese and Immigrants from Burma/Myanmar by Child Poverty Among Boys Under 16
In terms of child poverty among boys under 16, the demographic groups most similar to Marshallese are Immigrants from Nigeria (18.4%, a difference of 0.19%), Nicaraguan (18.4%, a difference of 0.20%), Nigerian (18.5%, a difference of 0.44%), American (18.6%, a difference of 0.94%), and Sudanese (18.6%, a difference of 1.0%). Similarly, the demographic groups most similar to Immigrants from Burma/Myanmar are French American Indian (19.2%, a difference of 0.030%), Alsatian (19.1%, a difference of 0.70%), Salvadoran (19.0%, a difference of 0.87%), Immigrants from Trinidad and Tobago (19.0%, a difference of 0.95%), and Immigrants from Nicaragua (19.0%, a difference of 1.1%).
| Demographics | Rating | Rank | Child Poverty Among Boys Under 16 |
| Nicaraguans | 1.4 /100 | #231 | Tragic 18.4% |
| Marshallese | 1.3 /100 | #232 | Tragic 18.4% |
| Immigrants | Nigeria | 1.2 /100 | #233 | Tragic 18.4% |
| Nigerians | 1.1 /100 | #234 | Tragic 18.5% |
| Americans | 0.9 /100 | #235 | Tragic 18.6% |
| Sudanese | 0.9 /100 | #236 | Tragic 18.6% |
| Immigrants | Eritrea | 0.8 /100 | #237 | Tragic 18.6% |
| Immigrants | Laos | 0.8 /100 | #238 | Tragic 18.7% |
| Cape Verdeans | 0.7 /100 | #239 | Tragic 18.7% |
| Immigrants | Cuba | 0.6 /100 | #240 | Tragic 18.8% |
| Immigrants | Sudan | 0.6 /100 | #241 | Tragic 18.8% |
| Ghanaians | 0.5 /100 | #242 | Tragic 18.9% |
| Immigrants | Azores | 0.4 /100 | #243 | Tragic 18.9% |
| Immigrants | Middle Africa | 0.4 /100 | #244 | Tragic 18.9% |
| Cree | 0.4 /100 | #245 | Tragic 19.0% |
| Immigrants | Nicaragua | 0.4 /100 | #246 | Tragic 19.0% |
| Immigrants | Trinidad and Tobago | 0.3 /100 | #247 | Tragic 19.0% |
| Salvadorans | 0.3 /100 | #248 | Tragic 19.0% |
| Alsatians | 0.3 /100 | #249 | Tragic 19.1% |
| Immigrants | Burma/Myanmar | 0.2 /100 | #250 | Tragic 19.2% |
| French American Indians | 0.2 /100 | #251 | Tragic 19.2% |