Ghanaian vs Ukrainian Poverty
COMPARE
Ghanaian
Ukrainian
Poverty
Poverty Comparison
Ghanaians
Ukrainians
13.9%
POVERTY
0.5/ 100
METRIC RATING
238th/ 347
METRIC RANK
11.2%
POVERTY
97.8/ 100
METRIC RATING
63rd/ 347
METRIC RANK
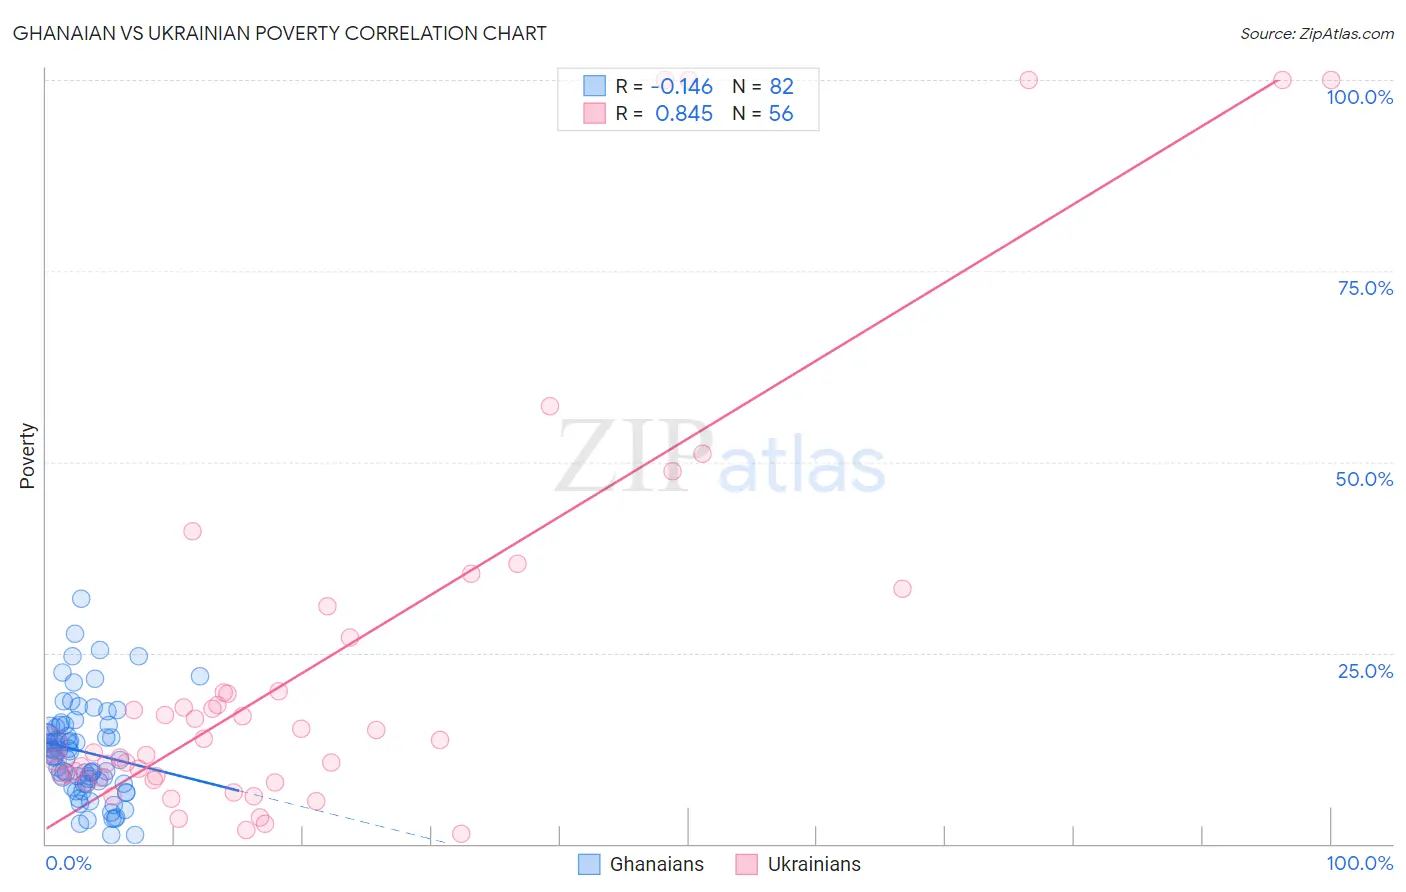
Ghanaian vs Ukrainian Poverty Correlation Chart
The statistical analysis conducted on geographies consisting of 190,556,077 people shows a poor negative correlation between the proportion of Ghanaians and poverty level in the United States with a correlation coefficient (R) of -0.146 and weighted average of 13.9%. Similarly, the statistical analysis conducted on geographies consisting of 448,287,905 people shows a very strong positive correlation between the proportion of Ukrainians and poverty level in the United States with a correlation coefficient (R) of 0.845 and weighted average of 11.2%, a difference of 24.3%.
Poverty Correlation Summary
| Measurement | Ghanaian | Ukrainian |
| Minimum | 1.1% | 1.3% |
| Maximum | 32.0% | 100.0% |
| Range | 30.9% | 98.7% |
| Mean | 12.1% | 23.6% |
| Median | 11.8% | 13.2% |
| Interquartile 25% (IQ1) | 7.9% | 8.7% |
| Interquartile 75% (IQ3) | 15.4% | 23.5% |
| Interquartile Range (IQR) | 7.5% | 14.7% |
| Standard Deviation (Sample) | 6.2% | 27.1% |
| Standard Deviation (Population) | 6.2% | 26.8% |
Similar Demographics by Poverty
Demographics Similar to Ghanaians by Poverty
In terms of poverty, the demographic groups most similar to Ghanaians are French American Indian (13.9%, a difference of 0.13%), Immigrants from Armenia (13.9%, a difference of 0.15%), Cuban (13.9%, a difference of 0.19%), Nicaraguan (13.9%, a difference of 0.35%), and Immigrants from Middle Africa (14.0%, a difference of 0.47%).
| Demographics | Rating | Rank | Poverty |
| Nigerians | 1.4 /100 | #231 | Tragic 13.6% |
| Fijians | 0.8 /100 | #232 | Tragic 13.7% |
| Immigrants | Saudi Arabia | 0.8 /100 | #233 | Tragic 13.8% |
| Immigrants | Laos | 0.7 /100 | #234 | Tragic 13.8% |
| Cubans | 0.6 /100 | #235 | Tragic 13.9% |
| Immigrants | Armenia | 0.5 /100 | #236 | Tragic 13.9% |
| French American Indians | 0.5 /100 | #237 | Tragic 13.9% |
| Ghanaians | 0.5 /100 | #238 | Tragic 13.9% |
| Nicaraguans | 0.4 /100 | #239 | Tragic 13.9% |
| Immigrants | Middle Africa | 0.4 /100 | #240 | Tragic 14.0% |
| Salvadorans | 0.4 /100 | #241 | Tragic 14.0% |
| Ecuadorians | 0.4 /100 | #242 | Tragic 14.0% |
| Sudanese | 0.3 /100 | #243 | Tragic 14.0% |
| Nepalese | 0.3 /100 | #244 | Tragic 14.0% |
| Immigrants | Sudan | 0.3 /100 | #245 | Tragic 14.1% |
Demographics Similar to Ukrainians by Poverty
In terms of poverty, the demographic groups most similar to Ukrainians are Austrian (11.2%, a difference of 0.0%), Immigrants from Italy (11.2%, a difference of 0.040%), Immigrants from Sri Lanka (11.2%, a difference of 0.10%), Swiss (11.2%, a difference of 0.22%), and Immigrants from Europe (11.2%, a difference of 0.26%).
| Demographics | Rating | Rank | Poverty |
| Estonians | 98.2 /100 | #56 | Exceptional 11.1% |
| Scandinavians | 98.2 /100 | #57 | Exceptional 11.1% |
| Germans | 98.1 /100 | #58 | Exceptional 11.1% |
| Immigrants | Europe | 98.0 /100 | #59 | Exceptional 11.2% |
| Immigrants | Sri Lanka | 97.9 /100 | #60 | Exceptional 11.2% |
| Immigrants | Italy | 97.9 /100 | #61 | Exceptional 11.2% |
| Austrians | 97.8 /100 | #62 | Exceptional 11.2% |
| Ukrainians | 97.8 /100 | #63 | Exceptional 11.2% |
| Swiss | 97.7 /100 | #64 | Exceptional 11.2% |
| Immigrants | Asia | 97.5 /100 | #65 | Exceptional 11.2% |
| Immigrants | Netherlands | 97.5 /100 | #66 | Exceptional 11.2% |
| Immigrants | Australia | 97.4 /100 | #67 | Exceptional 11.2% |
| Slovaks | 97.4 /100 | #68 | Exceptional 11.2% |
| Serbians | 97.4 /100 | #69 | Exceptional 11.2% |
| Immigrants | Canada | 97.3 /100 | #70 | Exceptional 11.3% |