Ghanaian vs Immigrants from Nicaragua Poverty
COMPARE
Ghanaian
Immigrants from Nicaragua
Poverty
Poverty Comparison
Ghanaians
Immigrants from Nicaragua
13.9%
POVERTY
0.5/ 100
METRIC RATING
238th/ 347
METRIC RANK
14.3%
POVERTY
0.1/ 100
METRIC RATING
259th/ 347
METRIC RANK
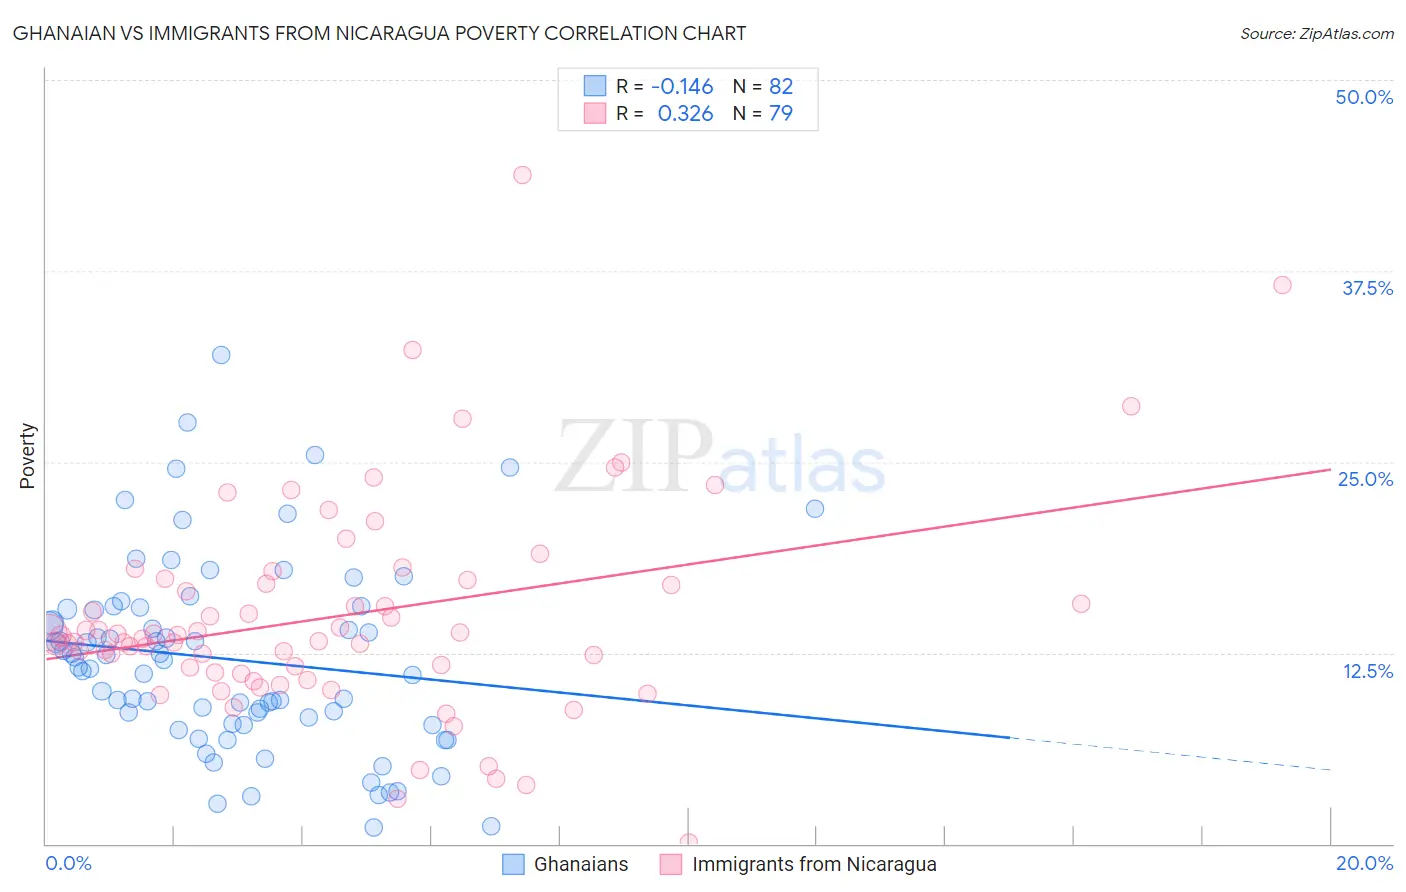
Ghanaian vs Immigrants from Nicaragua Poverty Correlation Chart
The statistical analysis conducted on geographies consisting of 190,556,077 people shows a poor negative correlation between the proportion of Ghanaians and poverty level in the United States with a correlation coefficient (R) of -0.146 and weighted average of 13.9%. Similarly, the statistical analysis conducted on geographies consisting of 236,320,114 people shows a mild positive correlation between the proportion of Immigrants from Nicaragua and poverty level in the United States with a correlation coefficient (R) of 0.326 and weighted average of 14.3%, a difference of 3.2%.
Poverty Correlation Summary
| Measurement | Ghanaian | Immigrants from Nicaragua |
| Minimum | 1.1% | 0.098% |
| Maximum | 32.0% | 43.8% |
| Range | 30.9% | 43.7% |
| Mean | 12.1% | 14.9% |
| Median | 11.8% | 13.6% |
| Interquartile 25% (IQ1) | 7.9% | 11.2% |
| Interquartile 75% (IQ3) | 15.4% | 17.3% |
| Interquartile Range (IQR) | 7.5% | 6.1% |
| Standard Deviation (Sample) | 6.2% | 7.1% |
| Standard Deviation (Population) | 6.2% | 7.0% |
Similar Demographics by Poverty
Demographics Similar to Ghanaians by Poverty
In terms of poverty, the demographic groups most similar to Ghanaians are French American Indian (13.9%, a difference of 0.13%), Immigrants from Armenia (13.9%, a difference of 0.15%), Cuban (13.9%, a difference of 0.19%), Nicaraguan (13.9%, a difference of 0.35%), and Immigrants from Middle Africa (14.0%, a difference of 0.47%).
| Demographics | Rating | Rank | Poverty |
| Nigerians | 1.4 /100 | #231 | Tragic 13.6% |
| Fijians | 0.8 /100 | #232 | Tragic 13.7% |
| Immigrants | Saudi Arabia | 0.8 /100 | #233 | Tragic 13.8% |
| Immigrants | Laos | 0.7 /100 | #234 | Tragic 13.8% |
| Cubans | 0.6 /100 | #235 | Tragic 13.9% |
| Immigrants | Armenia | 0.5 /100 | #236 | Tragic 13.9% |
| French American Indians | 0.5 /100 | #237 | Tragic 13.9% |
| Ghanaians | 0.5 /100 | #238 | Tragic 13.9% |
| Nicaraguans | 0.4 /100 | #239 | Tragic 13.9% |
| Immigrants | Middle Africa | 0.4 /100 | #240 | Tragic 14.0% |
| Salvadorans | 0.4 /100 | #241 | Tragic 14.0% |
| Ecuadorians | 0.4 /100 | #242 | Tragic 14.0% |
| Sudanese | 0.3 /100 | #243 | Tragic 14.0% |
| Nepalese | 0.3 /100 | #244 | Tragic 14.0% |
| Immigrants | Sudan | 0.3 /100 | #245 | Tragic 14.1% |
Demographics Similar to Immigrants from Nicaragua by Poverty
In terms of poverty, the demographic groups most similar to Immigrants from Nicaragua are Cape Verdean (14.4%, a difference of 0.080%), Cherokee (14.4%, a difference of 0.10%), Immigrants from Liberia (14.4%, a difference of 0.26%), Ottawa (14.3%, a difference of 0.27%), and Trinidadian and Tobagonian (14.3%, a difference of 0.28%).
| Demographics | Rating | Rank | Poverty |
| Spanish American Indians | 0.2 /100 | #252 | Tragic 14.2% |
| Immigrants | Trinidad and Tobago | 0.2 /100 | #253 | Tragic 14.2% |
| Immigrants | El Salvador | 0.1 /100 | #254 | Tragic 14.3% |
| Immigrants | Ecuador | 0.1 /100 | #255 | Tragic 14.3% |
| Mexican American Indians | 0.1 /100 | #256 | Tragic 14.3% |
| Trinidadians and Tobagonians | 0.1 /100 | #257 | Tragic 14.3% |
| Ottawa | 0.1 /100 | #258 | Tragic 14.3% |
| Immigrants | Nicaragua | 0.1 /100 | #259 | Tragic 14.3% |
| Cape Verdeans | 0.1 /100 | #260 | Tragic 14.4% |
| Cherokee | 0.1 /100 | #261 | Tragic 14.4% |
| Immigrants | Liberia | 0.1 /100 | #262 | Tragic 14.4% |
| Jamaicans | 0.1 /100 | #263 | Tragic 14.4% |
| Immigrants | Jamaica | 0.1 /100 | #264 | Tragic 14.4% |
| Immigrants | Guyana | 0.1 /100 | #265 | Tragic 14.5% |
| Guyanese | 0.1 /100 | #266 | Tragic 14.5% |