Samoan vs Ukrainian Poverty
COMPARE
Samoan
Ukrainian
Poverty
Poverty Comparison
Samoans
Ukrainians
12.0%
POVERTY
71.9/ 100
METRIC RATING
151st/ 347
METRIC RANK
11.2%
POVERTY
97.8/ 100
METRIC RATING
63rd/ 347
METRIC RANK
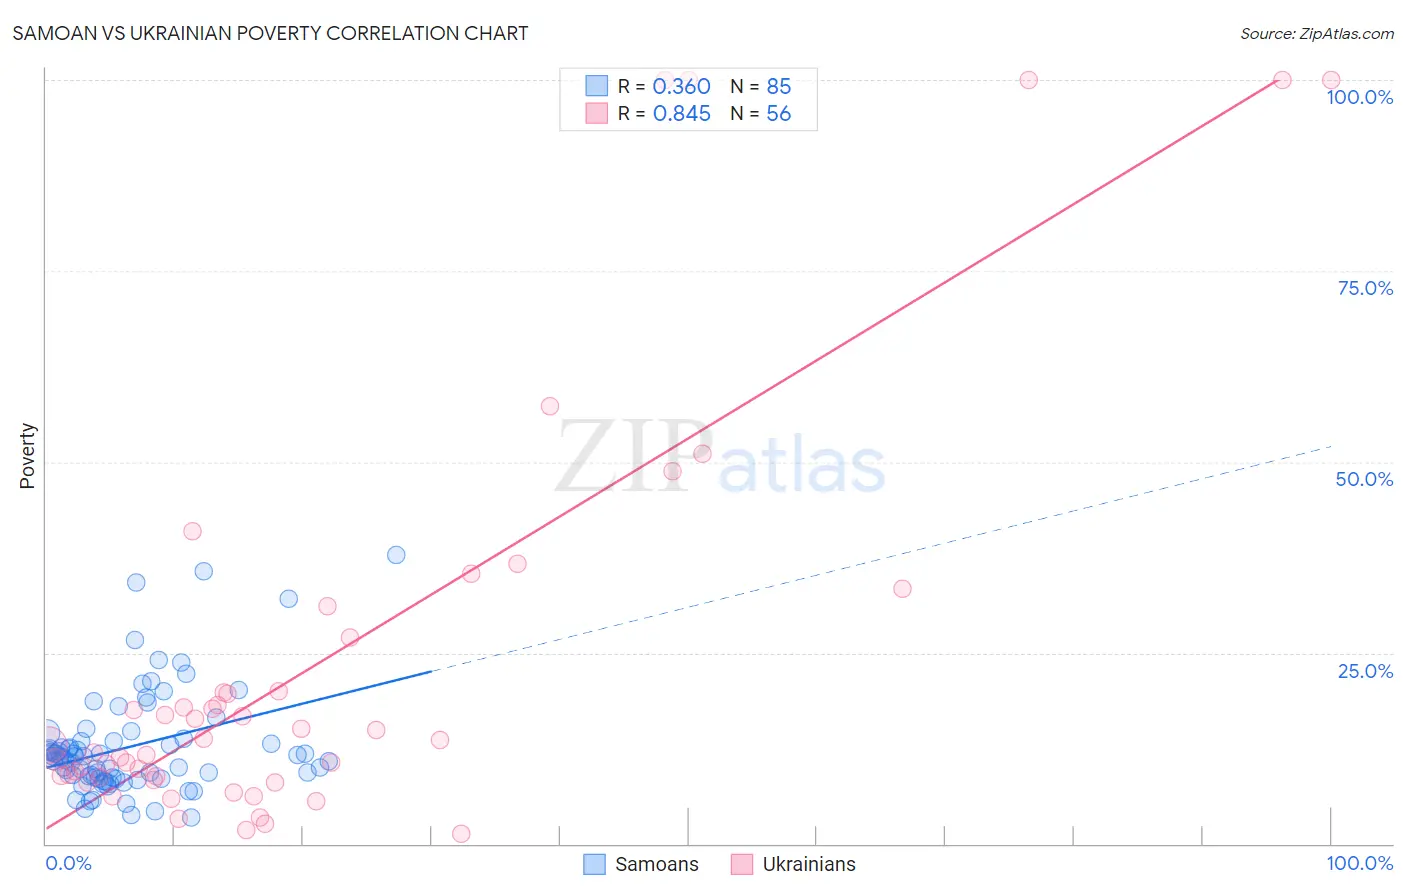
Samoan vs Ukrainian Poverty Correlation Chart
The statistical analysis conducted on geographies consisting of 225,074,148 people shows a mild positive correlation between the proportion of Samoans and poverty level in the United States with a correlation coefficient (R) of 0.360 and weighted average of 12.0%. Similarly, the statistical analysis conducted on geographies consisting of 448,287,905 people shows a very strong positive correlation between the proportion of Ukrainians and poverty level in the United States with a correlation coefficient (R) of 0.845 and weighted average of 11.2%, a difference of 7.7%.
Poverty Correlation Summary
| Measurement | Samoan | Ukrainian |
| Minimum | 3.5% | 1.3% |
| Maximum | 37.9% | 100.0% |
| Range | 34.4% | 98.7% |
| Mean | 12.7% | 23.6% |
| Median | 11.4% | 13.2% |
| Interquartile 25% (IQ1) | 8.6% | 8.7% |
| Interquartile 75% (IQ3) | 13.6% | 23.5% |
| Interquartile Range (IQR) | 5.0% | 14.7% |
| Standard Deviation (Sample) | 6.9% | 27.1% |
| Standard Deviation (Population) | 6.8% | 26.8% |
Similar Demographics by Poverty
Demographics Similar to Samoans by Poverty
In terms of poverty, the demographic groups most similar to Samoans are Immigrants from Kazakhstan (12.0%, a difference of 0.040%), Immigrants from Malaysia (12.0%, a difference of 0.090%), Immigrants from Germany (12.0%, a difference of 0.10%), Immigrants from Bosnia and Herzegovina (12.0%, a difference of 0.22%), and Afghan (12.0%, a difference of 0.38%).
| Demographics | Rating | Rank | Poverty |
| Icelanders | 77.9 /100 | #144 | Good 11.9% |
| Syrians | 75.1 /100 | #145 | Good 12.0% |
| Afghans | 74.9 /100 | #146 | Good 12.0% |
| Immigrants | Bosnia and Herzegovina | 73.7 /100 | #147 | Good 12.0% |
| Immigrants | Germany | 72.7 /100 | #148 | Good 12.0% |
| Immigrants | Malaysia | 72.7 /100 | #149 | Good 12.0% |
| Immigrants | Kazakhstan | 72.3 /100 | #150 | Good 12.0% |
| Samoans | 71.9 /100 | #151 | Good 12.0% |
| Armenians | 67.6 /100 | #152 | Good 12.1% |
| Immigrants | Northern Africa | 63.9 /100 | #153 | Good 12.1% |
| Guamanians/Chamorros | 63.9 /100 | #154 | Good 12.1% |
| Hungarians | 63.6 /100 | #155 | Good 12.2% |
| Scotch-Irish | 62.6 /100 | #156 | Good 12.2% |
| Costa Ricans | 62.2 /100 | #157 | Good 12.2% |
| Taiwanese | 61.8 /100 | #158 | Good 12.2% |
Demographics Similar to Ukrainians by Poverty
In terms of poverty, the demographic groups most similar to Ukrainians are Austrian (11.2%, a difference of 0.0%), Immigrants from Italy (11.2%, a difference of 0.040%), Immigrants from Sri Lanka (11.2%, a difference of 0.10%), Swiss (11.2%, a difference of 0.22%), and Immigrants from Europe (11.2%, a difference of 0.26%).
| Demographics | Rating | Rank | Poverty |
| Estonians | 98.2 /100 | #56 | Exceptional 11.1% |
| Scandinavians | 98.2 /100 | #57 | Exceptional 11.1% |
| Germans | 98.1 /100 | #58 | Exceptional 11.1% |
| Immigrants | Europe | 98.0 /100 | #59 | Exceptional 11.2% |
| Immigrants | Sri Lanka | 97.9 /100 | #60 | Exceptional 11.2% |
| Immigrants | Italy | 97.9 /100 | #61 | Exceptional 11.2% |
| Austrians | 97.8 /100 | #62 | Exceptional 11.2% |
| Ukrainians | 97.8 /100 | #63 | Exceptional 11.2% |
| Swiss | 97.7 /100 | #64 | Exceptional 11.2% |
| Immigrants | Asia | 97.5 /100 | #65 | Exceptional 11.2% |
| Immigrants | Netherlands | 97.5 /100 | #66 | Exceptional 11.2% |
| Immigrants | Australia | 97.4 /100 | #67 | Exceptional 11.2% |
| Slovaks | 97.4 /100 | #68 | Exceptional 11.2% |
| Serbians | 97.4 /100 | #69 | Exceptional 11.2% |
| Immigrants | Canada | 97.3 /100 | #70 | Exceptional 11.3% |