Ghanaian vs Cuban Family Poverty
COMPARE
Ghanaian
Cuban
Family Poverty
Family Poverty Comparison
Ghanaians
Cubans
10.3%
FAMILY POVERTY
1.3/ 100
METRIC RATING
241st/ 347
METRIC RANK
10.6%
FAMILY POVERTY
0.4/ 100
METRIC RATING
249th/ 347
METRIC RANK
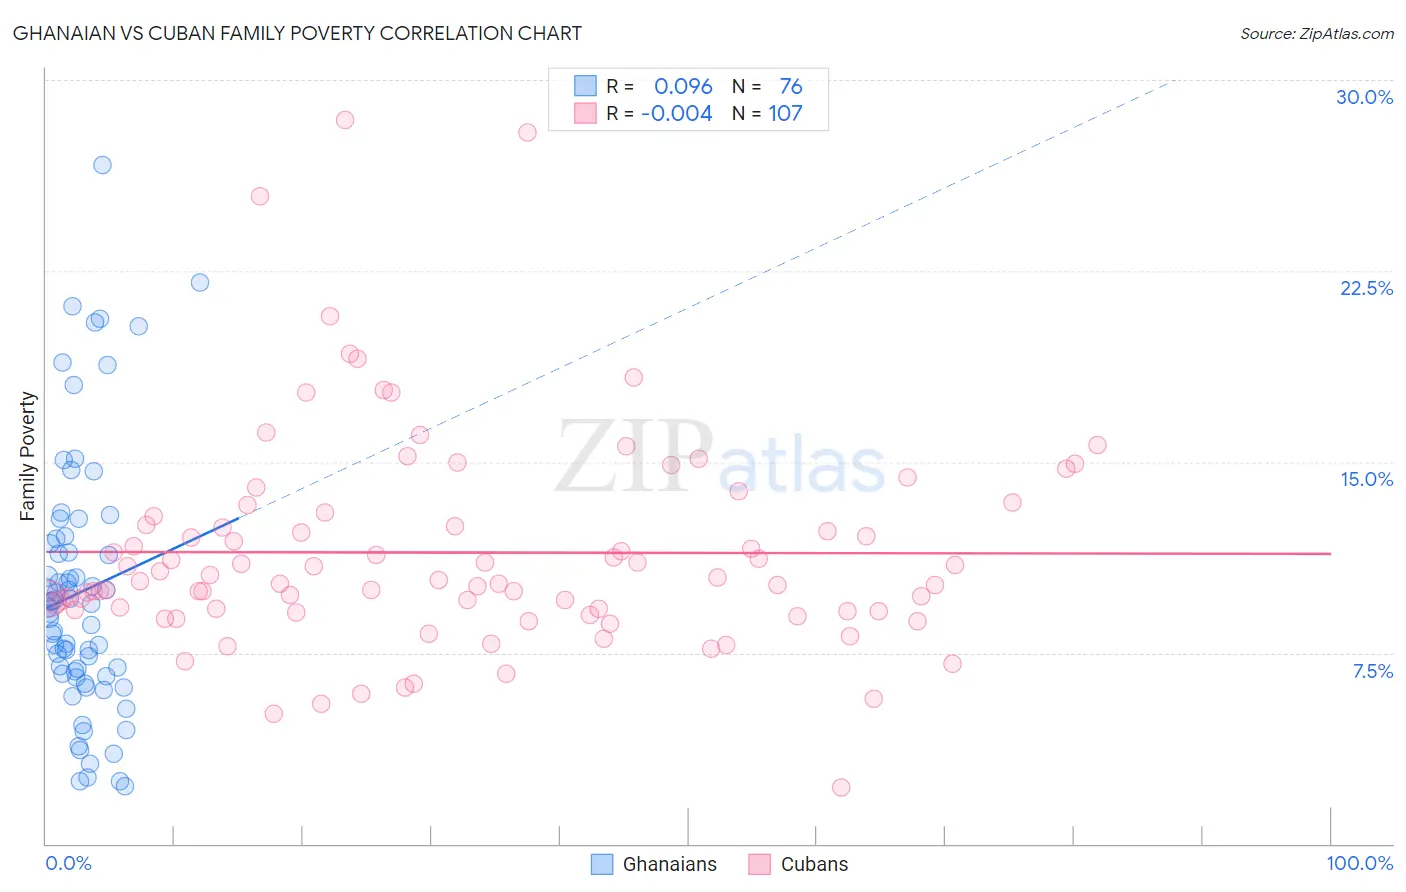
Ghanaian vs Cuban Family Poverty Correlation Chart
The statistical analysis conducted on geographies consisting of 190,166,438 people shows a slight positive correlation between the proportion of Ghanaians and poverty level among families in the United States with a correlation coefficient (R) of 0.096 and weighted average of 10.3%. Similarly, the statistical analysis conducted on geographies consisting of 447,916,186 people shows no correlation between the proportion of Cubans and poverty level among families in the United States with a correlation coefficient (R) of -0.004 and weighted average of 10.6%, a difference of 3.4%.
Family Poverty Correlation Summary
| Measurement | Ghanaian | Cuban |
| Minimum | 2.3% | 2.2% |
| Maximum | 26.7% | 28.4% |
| Range | 24.4% | 26.2% |
| Mean | 9.9% | 11.4% |
| Median | 9.3% | 10.3% |
| Interquartile 25% (IQ1) | 6.6% | 9.1% |
| Interquartile 75% (IQ3) | 11.9% | 12.9% |
| Interquartile Range (IQR) | 5.3% | 3.8% |
| Standard Deviation (Sample) | 5.1% | 4.2% |
| Standard Deviation (Population) | 5.1% | 4.2% |
Demographics Similar to Ghanaians and Cubans by Family Poverty
In terms of family poverty, the demographic groups most similar to Ghanaians are Immigrants from the Azores (10.3%, a difference of 0.090%), Potawatomi (10.2%, a difference of 0.39%), French American Indian (10.2%, a difference of 0.43%), Immigrants from Laos (10.2%, a difference of 0.80%), and Alaska Native (10.4%, a difference of 0.86%). Similarly, the demographic groups most similar to Cubans are Nicaraguan (10.6%, a difference of 0.050%), Liberian (10.6%, a difference of 0.25%), Cherokee (10.6%, a difference of 0.34%), Salvadoran (10.7%, a difference of 0.53%), and Iroquois (10.7%, a difference of 0.81%).
| Demographics | Rating | Rank | Family Poverty |
| Nigerians | 2.0 /100 | #235 | Tragic 10.1% |
| Immigrants | Nigeria | 1.9 /100 | #236 | Tragic 10.2% |
| Immigrants | Laos | 1.7 /100 | #237 | Tragic 10.2% |
| French American Indians | 1.5 /100 | #238 | Tragic 10.2% |
| Potawatomi | 1.5 /100 | #239 | Tragic 10.2% |
| Immigrants | Azores | 1.4 /100 | #240 | Tragic 10.3% |
| Ghanaians | 1.3 /100 | #241 | Tragic 10.3% |
| Alaska Natives | 1.0 /100 | #242 | Tragic 10.4% |
| Nepalese | 0.8 /100 | #243 | Tragic 10.4% |
| Cree | 0.7 /100 | #244 | Tragic 10.5% |
| Immigrants | Burma/Myanmar | 0.6 /100 | #245 | Tragic 10.5% |
| Cherokee | 0.5 /100 | #246 | Tragic 10.6% |
| Liberians | 0.4 /100 | #247 | Tragic 10.6% |
| Nicaraguans | 0.4 /100 | #248 | Tragic 10.6% |
| Cubans | 0.4 /100 | #249 | Tragic 10.6% |
| Salvadorans | 0.3 /100 | #250 | Tragic 10.7% |
| Iroquois | 0.3 /100 | #251 | Tragic 10.7% |
| Immigrants | Zaire | 0.3 /100 | #252 | Tragic 10.7% |
| Immigrants | Western Africa | 0.3 /100 | #253 | Tragic 10.7% |
| Ecuadorians | 0.2 /100 | #254 | Tragic 10.8% |
| Immigrants | Liberia | 0.2 /100 | #255 | Tragic 10.8% |