French American Indian vs Mongolian Female Poverty Among 18-24 Year Olds
COMPARE
French American Indian
Mongolian
Female Poverty Among 18-24 Year Olds
Female Poverty Among 18-24 Year Olds Comparison
French American Indians
Mongolians
22.3%
FEMALE POVERTY AMONG 18-24 YEAR OLDS
0.0/ 100
METRIC RATING
289th/ 347
METRIC RANK
21.6%
FEMALE POVERTY AMONG 18-24 YEAR OLDS
0.2/ 100
METRIC RATING
270th/ 347
METRIC RANK
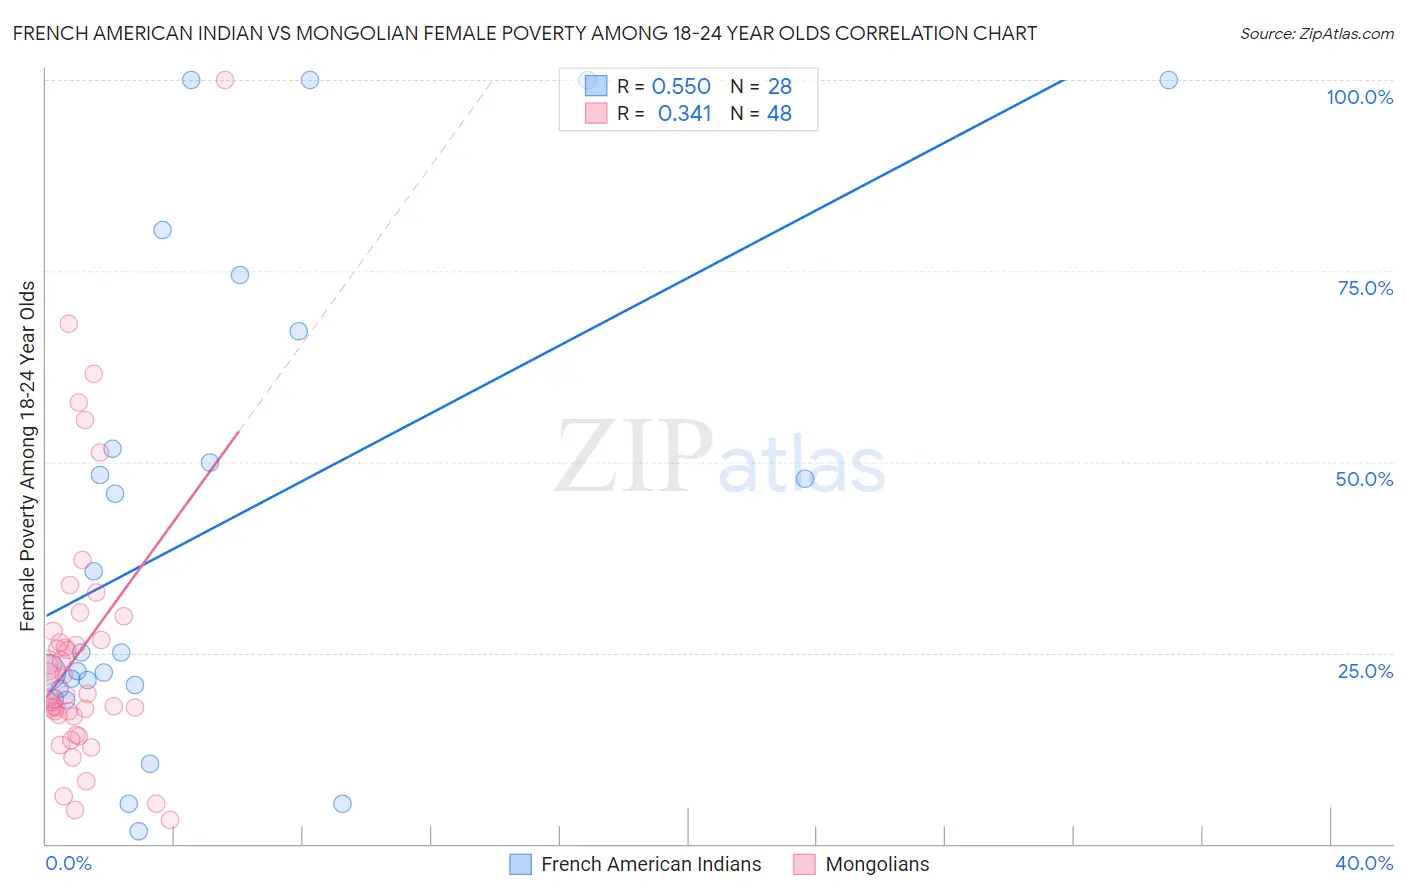
French American Indian vs Mongolian Female Poverty Among 18-24 Year Olds Correlation Chart
The statistical analysis conducted on geographies consisting of 130,637,035 people shows a substantial positive correlation between the proportion of French American Indians and poverty level among females between the ages 18 and 24 in the United States with a correlation coefficient (R) of 0.550 and weighted average of 22.3%. Similarly, the statistical analysis conducted on geographies consisting of 139,425,379 people shows a mild positive correlation between the proportion of Mongolians and poverty level among females between the ages 18 and 24 in the United States with a correlation coefficient (R) of 0.341 and weighted average of 21.6%, a difference of 3.1%.
Female Poverty Among 18-24 Year Olds Correlation Summary
| Measurement | French American Indian | Mongolian |
| Minimum | 1.6% | 3.0% |
| Maximum | 100.0% | 100.0% |
| Range | 98.4% | 97.0% |
| Mean | 41.6% | 25.3% |
| Median | 25.1% | 19.6% |
| Interquartile 25% (IQ1) | 20.6% | 16.8% |
| Interquartile 75% (IQ3) | 59.4% | 27.2% |
| Interquartile Range (IQR) | 38.8% | 10.5% |
| Standard Deviation (Sample) | 31.5% | 18.1% |
| Standard Deviation (Population) | 30.9% | 17.9% |
Demographics Similar to French American Indians and Mongolians by Female Poverty Among 18-24 Year Olds
In terms of female poverty among 18-24 year olds, the demographic groups most similar to French American Indians are Dominican (22.3%, a difference of 0.070%), Immigrants from Middle Africa (22.1%, a difference of 0.83%), Ugandan (22.1%, a difference of 0.84%), Ottawa (22.0%, a difference of 1.0%), and Tlingit-Haida (22.0%, a difference of 1.1%). Similarly, the demographic groups most similar to Mongolians are Scotch-Irish (21.6%, a difference of 0.010%), Celtic (21.6%, a difference of 0.030%), Basque (21.7%, a difference of 0.29%), New Zealander (21.7%, a difference of 0.43%), and Immigrants from Honduras (21.8%, a difference of 0.82%).
| Demographics | Rating | Rank | Female Poverty Among 18-24 Year Olds |
| Celtics | 0.2 /100 | #269 | Tragic 21.6% |
| Mongolians | 0.2 /100 | #270 | Tragic 21.6% |
| Scotch-Irish | 0.2 /100 | #271 | Tragic 21.6% |
| Basques | 0.2 /100 | #272 | Tragic 21.7% |
| New Zealanders | 0.2 /100 | #273 | Tragic 21.7% |
| Immigrants | Honduras | 0.1 /100 | #274 | Tragic 21.8% |
| Immigrants | Bangladesh | 0.1 /100 | #275 | Tragic 21.8% |
| Bahamians | 0.1 /100 | #276 | Tragic 21.8% |
| Immigrants | Switzerland | 0.1 /100 | #277 | Tragic 21.8% |
| Yaqui | 0.1 /100 | #278 | Tragic 21.9% |
| Spanish Americans | 0.1 /100 | #279 | Tragic 21.9% |
| Immigrants | Dominica | 0.1 /100 | #280 | Tragic 21.9% |
| Immigrants | Dominican Republic | 0.1 /100 | #281 | Tragic 21.9% |
| Bermudans | 0.1 /100 | #282 | Tragic 21.9% |
| Sub-Saharan Africans | 0.0 /100 | #283 | Tragic 22.0% |
| Tlingit-Haida | 0.0 /100 | #284 | Tragic 22.0% |
| Ottawa | 0.0 /100 | #285 | Tragic 22.0% |
| Ugandans | 0.0 /100 | #286 | Tragic 22.1% |
| Immigrants | Middle Africa | 0.0 /100 | #287 | Tragic 22.1% |
| Dominicans | 0.0 /100 | #288 | Tragic 22.3% |
| French American Indians | 0.0 /100 | #289 | Tragic 22.3% |