French American Indian vs Samoan Female Poverty
COMPARE
French American Indian
Samoan
Female Poverty
Female Poverty Comparison
French American Indians
Samoans
15.1%
FEMALE POVERTY
0.6/ 100
METRIC RATING
237th/ 347
METRIC RANK
13.1%
FEMALE POVERTY
73.6/ 100
METRIC RATING
152nd/ 347
METRIC RANK
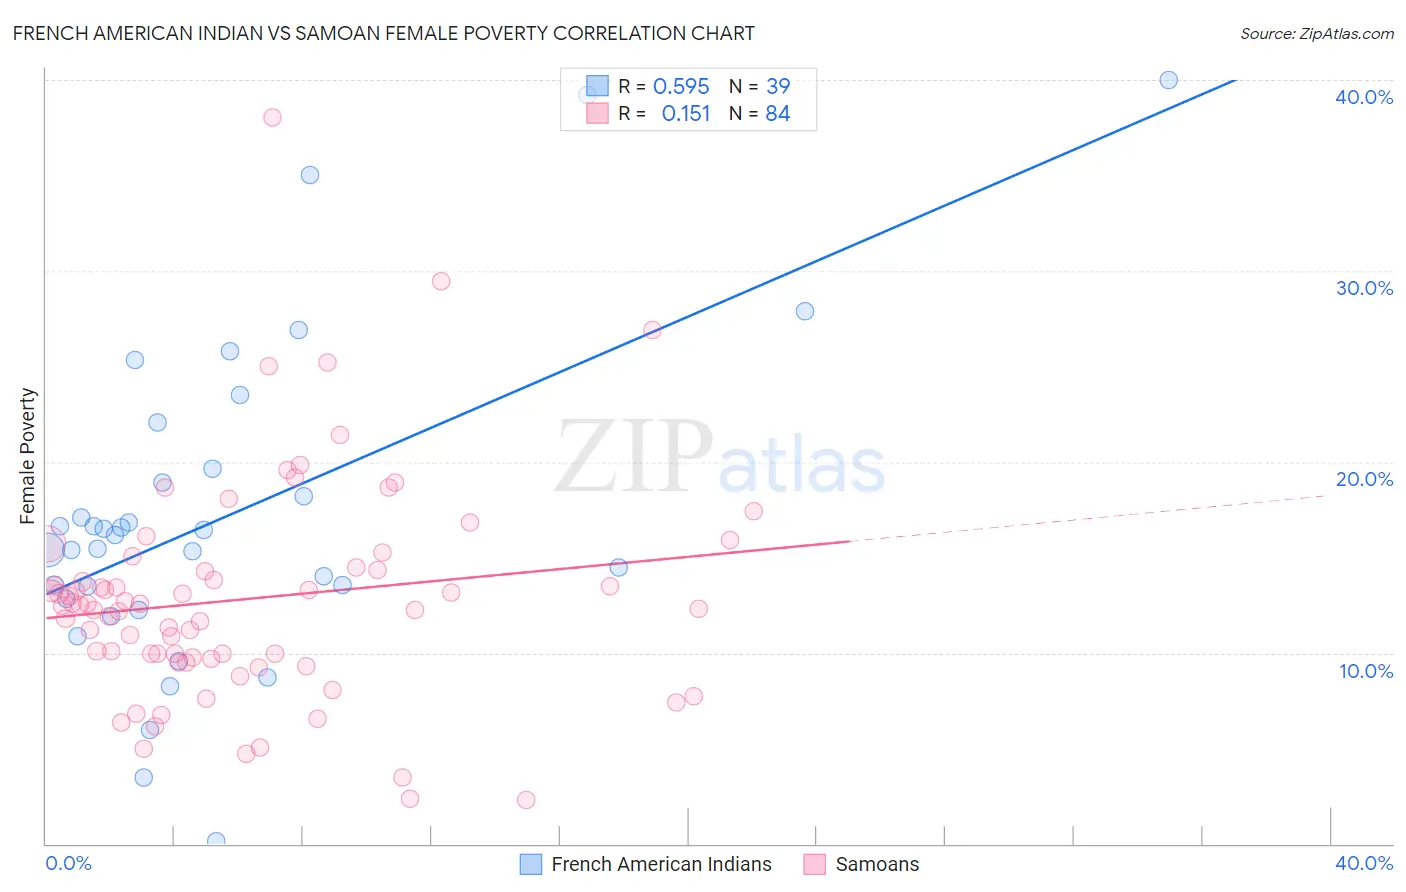
French American Indian vs Samoan Female Poverty Correlation Chart
The statistical analysis conducted on geographies consisting of 131,968,938 people shows a substantial positive correlation between the proportion of French American Indians and poverty level among females in the United States with a correlation coefficient (R) of 0.595 and weighted average of 15.1%. Similarly, the statistical analysis conducted on geographies consisting of 225,052,897 people shows a poor positive correlation between the proportion of Samoans and poverty level among females in the United States with a correlation coefficient (R) of 0.151 and weighted average of 13.1%, a difference of 15.0%.
Female Poverty Correlation Summary
| Measurement | French American Indian | Samoan |
| Minimum | 0.16% | 2.3% |
| Maximum | 40.0% | 38.0% |
| Range | 39.8% | 35.7% |
| Mean | 17.2% | 12.8% |
| Median | 16.2% | 12.5% |
| Interquartile 25% (IQ1) | 12.8% | 9.7% |
| Interquartile 75% (IQ3) | 19.6% | 14.4% |
| Interquartile Range (IQR) | 6.8% | 4.7% |
| Standard Deviation (Sample) | 8.5% | 5.8% |
| Standard Deviation (Population) | 8.4% | 5.8% |
Similar Demographics by Female Poverty
Demographics Similar to French American Indians by Female Poverty
In terms of female poverty, the demographic groups most similar to French American Indians are Immigrants from Armenia (15.1%, a difference of 0.080%), Cree (15.1%, a difference of 0.19%), Immigrants from Middle Africa (15.2%, a difference of 0.59%), Sudanese (15.2%, a difference of 0.65%), and Immigrants from Laos (15.0%, a difference of 0.82%).
| Demographics | Rating | Rank | Female Poverty |
| Alaska Natives | 1.8 /100 | #230 | Tragic 14.7% |
| Nigerians | 1.7 /100 | #231 | Tragic 14.8% |
| Osage | 1.5 /100 | #232 | Tragic 14.8% |
| Immigrants | Saudi Arabia | 1.4 /100 | #233 | Tragic 14.8% |
| Fijians | 1.1 /100 | #234 | Tragic 14.9% |
| Immigrants | Laos | 0.9 /100 | #235 | Tragic 15.0% |
| Cree | 0.7 /100 | #236 | Tragic 15.1% |
| French American Indians | 0.6 /100 | #237 | Tragic 15.1% |
| Immigrants | Armenia | 0.6 /100 | #238 | Tragic 15.1% |
| Immigrants | Middle Africa | 0.5 /100 | #239 | Tragic 15.2% |
| Sudanese | 0.5 /100 | #240 | Tragic 15.2% |
| Immigrants | Sudan | 0.4 /100 | #241 | Tragic 15.2% |
| Nepalese | 0.4 /100 | #242 | Tragic 15.2% |
| Nicaraguans | 0.3 /100 | #243 | Tragic 15.3% |
| Ecuadorians | 0.3 /100 | #244 | Tragic 15.3% |
Demographics Similar to Samoans by Female Poverty
In terms of female poverty, the demographic groups most similar to Samoans are Immigrants from Germany (13.1%, a difference of 0.17%), Tsimshian (13.1%, a difference of 0.24%), Taiwanese (13.1%, a difference of 0.27%), Immigrants from Fiji (13.2%, a difference of 0.32%), and Armenian (13.2%, a difference of 0.39%).
| Demographics | Rating | Rank | Female Poverty |
| Syrians | 79.6 /100 | #145 | Good 13.0% |
| Immigrants | Peru | 79.1 /100 | #146 | Good 13.0% |
| Immigrants | Kazakhstan | 78.6 /100 | #147 | Good 13.0% |
| Yugoslavians | 76.9 /100 | #148 | Good 13.1% |
| Taiwanese | 75.7 /100 | #149 | Good 13.1% |
| Tsimshian | 75.5 /100 | #150 | Good 13.1% |
| Immigrants | Germany | 74.9 /100 | #151 | Good 13.1% |
| Samoans | 73.6 /100 | #152 | Good 13.1% |
| Immigrants | Fiji | 71.0 /100 | #153 | Good 13.2% |
| Armenians | 70.4 /100 | #154 | Good 13.2% |
| Hungarians | 70.1 /100 | #155 | Good 13.2% |
| Immigrants | Bosnia and Herzegovina | 69.7 /100 | #156 | Good 13.2% |
| Immigrants | Northern Africa | 68.8 /100 | #157 | Good 13.2% |
| Pennsylvania Germans | 67.3 /100 | #158 | Good 13.2% |
| Costa Ricans | 63.6 /100 | #159 | Good 13.3% |