French American Indian vs Immigrants from England Female Poverty
COMPARE
French American Indian
Immigrants from England
Female Poverty
Female Poverty Comparison
French American Indians
Immigrants from England
15.1%
FEMALE POVERTY
0.6/ 100
METRIC RATING
237th/ 347
METRIC RANK
12.3%
FEMALE POVERTY
96.9/ 100
METRIC RATING
83rd/ 347
METRIC RANK
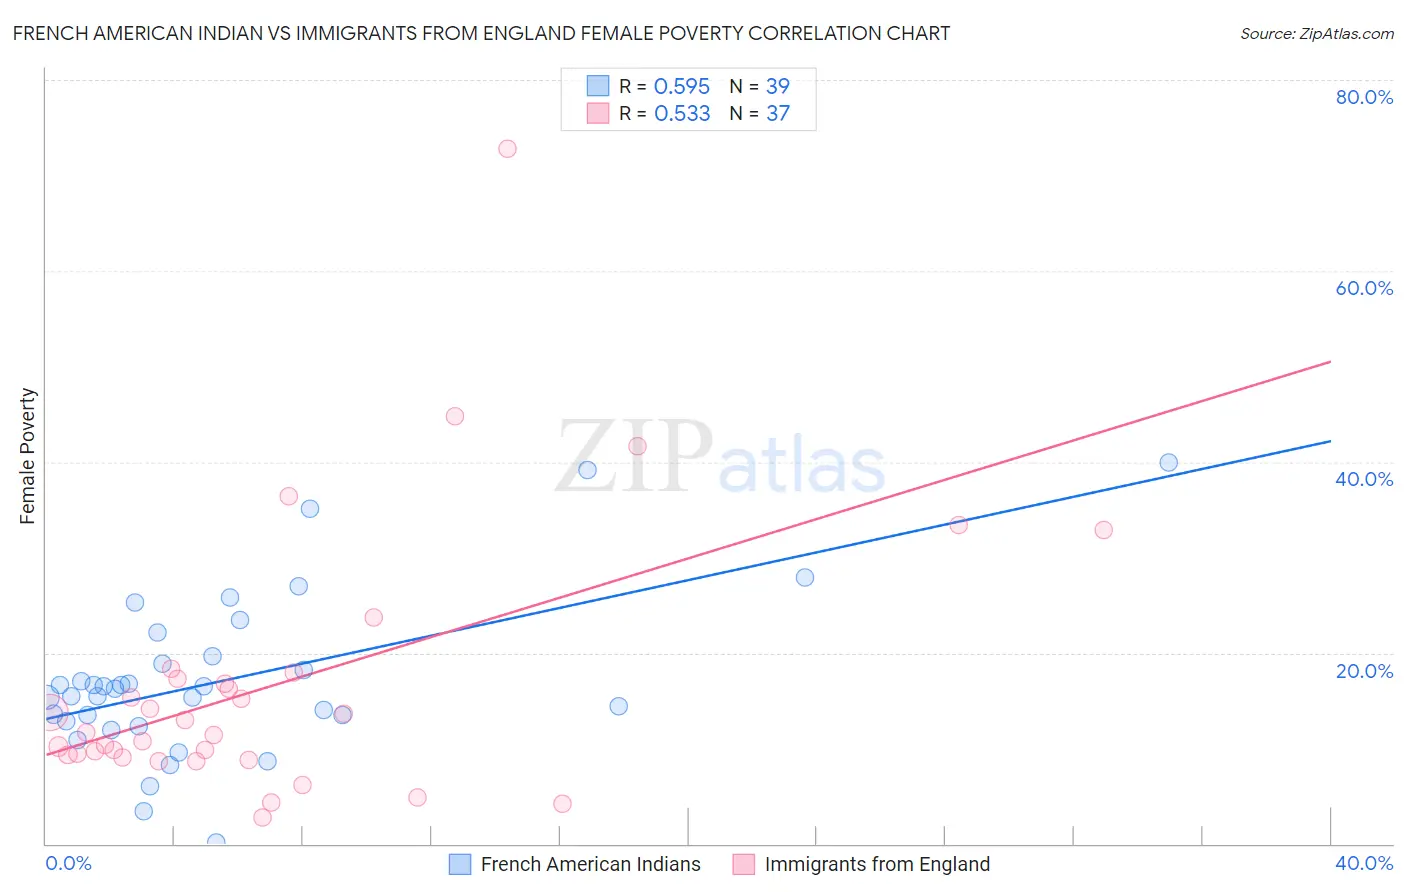
French American Indian vs Immigrants from England Female Poverty Correlation Chart
The statistical analysis conducted on geographies consisting of 131,968,938 people shows a substantial positive correlation between the proportion of French American Indians and poverty level among females in the United States with a correlation coefficient (R) of 0.595 and weighted average of 15.1%. Similarly, the statistical analysis conducted on geographies consisting of 391,675,853 people shows a substantial positive correlation between the proportion of Immigrants from England and poverty level among females in the United States with a correlation coefficient (R) of 0.533 and weighted average of 12.3%, a difference of 22.3%.
Female Poverty Correlation Summary
| Measurement | French American Indian | Immigrants from England |
| Minimum | 0.16% | 2.7% |
| Maximum | 40.0% | 72.8% |
| Range | 39.8% | 70.1% |
| Mean | 17.2% | 16.7% |
| Median | 16.2% | 11.6% |
| Interquartile 25% (IQ1) | 12.8% | 9.2% |
| Interquartile 75% (IQ3) | 19.6% | 17.6% |
| Interquartile Range (IQR) | 6.8% | 8.4% |
| Standard Deviation (Sample) | 8.5% | 13.9% |
| Standard Deviation (Population) | 8.4% | 13.8% |
Similar Demographics by Female Poverty
Demographics Similar to French American Indians by Female Poverty
In terms of female poverty, the demographic groups most similar to French American Indians are Immigrants from Armenia (15.1%, a difference of 0.080%), Cree (15.1%, a difference of 0.19%), Immigrants from Middle Africa (15.2%, a difference of 0.59%), Sudanese (15.2%, a difference of 0.65%), and Immigrants from Laos (15.0%, a difference of 0.82%).
| Demographics | Rating | Rank | Female Poverty |
| Alaska Natives | 1.8 /100 | #230 | Tragic 14.7% |
| Nigerians | 1.7 /100 | #231 | Tragic 14.8% |
| Osage | 1.5 /100 | #232 | Tragic 14.8% |
| Immigrants | Saudi Arabia | 1.4 /100 | #233 | Tragic 14.8% |
| Fijians | 1.1 /100 | #234 | Tragic 14.9% |
| Immigrants | Laos | 0.9 /100 | #235 | Tragic 15.0% |
| Cree | 0.7 /100 | #236 | Tragic 15.1% |
| French American Indians | 0.6 /100 | #237 | Tragic 15.1% |
| Immigrants | Armenia | 0.6 /100 | #238 | Tragic 15.1% |
| Immigrants | Middle Africa | 0.5 /100 | #239 | Tragic 15.2% |
| Sudanese | 0.5 /100 | #240 | Tragic 15.2% |
| Immigrants | Sudan | 0.4 /100 | #241 | Tragic 15.2% |
| Nepalese | 0.4 /100 | #242 | Tragic 15.2% |
| Nicaraguans | 0.3 /100 | #243 | Tragic 15.3% |
| Ecuadorians | 0.3 /100 | #244 | Tragic 15.3% |
Demographics Similar to Immigrants from England by Female Poverty
In terms of female poverty, the demographic groups most similar to Immigrants from England are Jordanian (12.3%, a difference of 0.18%), Slovak (12.3%, a difference of 0.19%), Immigrants from Sweden (12.3%, a difference of 0.19%), Northern European (12.4%, a difference of 0.23%), and Immigrants from North America (12.3%, a difference of 0.24%).
| Demographics | Rating | Rank | Female Poverty |
| Immigrants | Eastern Europe | 97.2 /100 | #76 | Exceptional 12.3% |
| Serbians | 97.2 /100 | #77 | Exceptional 12.3% |
| Egyptians | 97.2 /100 | #78 | Exceptional 12.3% |
| Immigrants | North America | 97.1 /100 | #79 | Exceptional 12.3% |
| Slovaks | 97.1 /100 | #80 | Exceptional 12.3% |
| Immigrants | Sweden | 97.1 /100 | #81 | Exceptional 12.3% |
| Jordanians | 97.1 /100 | #82 | Exceptional 12.3% |
| Immigrants | England | 96.9 /100 | #83 | Exceptional 12.3% |
| Northern Europeans | 96.6 /100 | #84 | Exceptional 12.4% |
| Irish | 96.5 /100 | #85 | Exceptional 12.4% |
| Dutch | 96.5 /100 | #86 | Exceptional 12.4% |
| Okinawans | 96.4 /100 | #87 | Exceptional 12.4% |
| Finns | 96.4 /100 | #88 | Exceptional 12.4% |
| English | 96.1 /100 | #89 | Exceptional 12.4% |
| Immigrants | Denmark | 95.8 /100 | #90 | Exceptional 12.4% |