Finnish vs Immigrants from Israel Single Female Poverty

COMPARE

Finnish
Race
Ancestry
AfghanAfricanAlaska NativeAlaskan AthabascanAlbanianAleutAlsatianAmericanApacheArabArapahoArgentineanArmenianAssyrian/Chaldean/SyriacAustralianAustrianBahamianBangladeshiBarbadianBasqueBelgianBelizeanBermudanBhutaneseBlackfeetBolivianBrazilianBritishBritish West IndianBulgarianBurmeseCajunCambodianCanadianCape VerdeanCarpatho RusynCelticCentral AmericanCentral American IndianCherokeeCheyenneChickasawChileanChineseChippewaChoctawColombianColvilleComancheCosta RicanCreeCreekCroatianCrowCubanCypriotCzechCzechoslovakianDanishDelawareDominicanDutchDutch West IndianEastern EuropeanEcuadorianEgyptianEnglishEstonianEthiopianEuropeanFijianFilipinoFinnishFrenchFrench American IndianFrench CanadianGermanGerman RussianGhanaianGreekGuamanian/ChamorroGuatemalanGuyaneseHaitianHmongHonduranHopiHoumaHungarianIcelanderIndian (Asian)IndonesianInupiatIranianIraqiIrishIroquoisIsraeliItalianJamaicanJapaneseJordanianKenyanKiowaKoreanLaotianLatvianLebaneseLiberianLithuanianLumbeeLuxembourgerMacedonianMalaysianMalteseMarshalleseMenomineeMexicanMexican American IndianMongolianMoroccanNative HawaiianNavajoNepaleseNew ZealanderNicaraguanNigerianNorthern EuropeanNorwegianOkinawanOsageOttawaPaiutePakistaniPalestinianPanamanianParaguayanPennsylvania GermanPeruvianPimaPolishPortuguesePotawatomiPuebloPuerto RicanPuget Sound SalishRomanianRussianSalvadoranSamoanScandinavianScotch-IrishScottishSeminoleSenegaleseSerbianShoshoneSierra LeoneanSiouxSlavicSlovakSloveneSomaliSouth AfricanSouth AmericanSouth American IndianSoviet UnionSpaniardSpanishSpanish AmericanSpanish American IndianSri LankanSubsaharan AfricanSudaneseSwedishSwissSyrianTaiwaneseThaiTlingit-HaidaTohono O'OdhamTonganTrinidadian and TobagonianTsimshianTurkishU.S. Virgin IslanderUgandanUkrainianUruguayanUteVenezuelanVietnameseWelshWest IndianYakamaYaquiYugoslavianYumanYup'ikZimbabwean
Immigration
NonimmigrantsImmigrantsAfghanistanAfricaAlbaniaArgentinaArmeniaAsiaAustraliaAustriaBahamasBangladeshBarbadosBelarusBelgiumBelizeBoliviaBosnia and HerzegovinaBrazilBulgariaBurma/MyanmarCabo VerdeCambodiaCameroonCanadaCaribbeanCentral AmericaChileChinaColombiaCongoCosta RicaCroatiaCubaCzechoslovakiaDenmarkDominicaDominican RepublicEastern AfricaEastern AsiaEastern EuropeEcuadorEgyptEl SalvadorEnglandEritreaEthiopiaEuropeFijiFranceGermanyGhanaGreeceGrenadaGuatemalaGuyanaHaitiHondurasHong KongHungaryIndiaIndonesiaIranIraqIrelandItalyJamaicaJapanJordanKazakhstanKenyaKoreaKuwaitLaosLatin AmericaLatviaLebanonLiberiaLithuaniaMalaysiaMexicoMicronesiaMiddle AfricaMoldovaMoroccoNepalNetherlandsNicaraguaNigeriaNorth AmericaNorth MacedoniaNorthern AfricaNorthern EuropeNorwayOceaniaPakistanPanamaPeruPhilippinesPolandPortugalRomaniaRussiaSaudi ArabiaScotlandSenegalSerbiaSierra LeoneSingaporeSomaliaSouth AfricaSouth AmericaSouth Central AsiaSouth Eastern AsiaSouthern EuropeSpainSri LankaSt. Vincent and the GrenadinesSudanSwedenSwitzerlandSyriaTaiwanThailandTrinidad and TobagoTurkeyUgandaUkraineUruguayUzbekistanVenezuelaVietnamWest IndiesWestern AfricaWestern AsiaWestern EuropeYemenZaireZimbabweAzores
Immigrants from Israel
Race
Ancestry
AfghanAfricanAlaska NativeAlaskan AthabascanAlbanianAleutAlsatianAmericanApacheArabArapahoArgentineanArmenianAssyrian/Chaldean/SyriacAustralianAustrianBahamianBangladeshiBarbadianBasqueBelgianBelizeanBermudanBhutaneseBlackfeetBolivianBrazilianBritishBritish West IndianBulgarianBurmeseCajunCambodianCanadianCape VerdeanCarpatho RusynCelticCentral AmericanCentral American IndianCherokeeCheyenneChickasawChileanChineseChippewaChoctawColombianColvilleComancheCosta RicanCreeCreekCroatianCrowCubanCypriotCzechCzechoslovakianDanishDelawareDominicanDutchDutch West IndianEastern EuropeanEcuadorianEgyptianEnglishEstonianEthiopianEuropeanFijianFilipinoFrenchFrench American IndianFrench CanadianGermanGerman RussianGhanaianGreekGuamanian/ChamorroGuatemalanGuyaneseHaitianHmongHonduranHopiHoumaHungarianIcelanderIndian (Asian)IndonesianInupiatIranianIraqiIrishIroquoisIsraeliItalianJamaicanJapaneseJordanianKenyanKiowaKoreanLaotianLatvianLebaneseLiberianLithuanianLumbeeLuxembourgerMacedonianMalaysianMalteseMarshalleseMenomineeMexicanMexican American IndianMongolianMoroccanNative HawaiianNavajoNepaleseNew ZealanderNicaraguanNigerianNorthern EuropeanNorwegianOkinawanOsageOttawaPaiutePakistaniPalestinianPanamanianParaguayanPennsylvania GermanPeruvianPimaPolishPortuguesePotawatomiPuebloPuerto RicanPuget Sound SalishRomanianRussianSalvadoranSamoanScandinavianScotch-IrishScottishSeminoleSenegaleseSerbianShoshoneSierra LeoneanSiouxSlavicSlovakSloveneSomaliSouth AfricanSouth AmericanSouth American IndianSoviet UnionSpaniardSpanishSpanish AmericanSpanish American IndianSri LankanSubsaharan AfricanSudaneseSwedishSwissSyrianTaiwaneseThaiTlingit-HaidaTohono O'OdhamTonganTrinidadian and TobagonianTsimshianTurkishU.S. Virgin IslanderUgandanUkrainianUruguayanUteVenezuelanVietnameseWelshWest IndianYakamaYaquiYugoslavianYumanYup'ikZimbabwean
Immigration
NonimmigrantsImmigrantsAfghanistanAfricaAlbaniaArgentinaArmeniaAsiaAustraliaAustriaBahamasBangladeshBarbadosBelarusBelgiumBelizeBoliviaBosnia and HerzegovinaBrazilBulgariaBurma/MyanmarCabo VerdeCambodiaCameroonCanadaCaribbeanCentral AmericaChileChinaColombiaCongoCosta RicaCroatiaCubaCzechoslovakiaDenmarkDominicaDominican RepublicEastern AfricaEastern AsiaEastern EuropeEcuadorEgyptEl SalvadorEnglandEritreaEthiopiaEuropeFijiFranceGermanyGhanaGreeceGrenadaGuatemalaGuyanaHaitiHondurasHong KongHungaryIndiaIndonesiaIranIraqIrelandIsraelItalyJamaicaJapanJordanKazakhstanKenyaKoreaKuwaitLaosLatin AmericaLatviaLebanonLiberiaLithuaniaMalaysiaMexicoMicronesiaMiddle AfricaMoldovaMoroccoNepalNetherlandsNicaraguaNigeriaNorth AmericaNorth MacedoniaNorthern AfricaNorthern EuropeNorwayOceaniaPakistanPanamaPeruPhilippinesPolandPortugalRomaniaRussiaSaudi ArabiaScotlandSenegalSerbiaSierra LeoneSingaporeSomaliaSouth AfricaSouth AmericaSouth Central AsiaSouth Eastern AsiaSouthern EuropeSpainSri LankaSt. Vincent and the GrenadinesSudanSwedenSwitzerlandSyriaTaiwanThailandTrinidad and TobagoTurkeyUgandaUkraineUruguayUzbekistanVenezuelaVietnamWest IndiesWestern AfricaWestern AsiaWestern EuropeYemenZaireZimbabweAzores
Single Female Poverty
Income
Poverty
Unemployment
Labor Participation
Family Structure
Vehicle Availability
Education Level
Disability

Single Female Poverty Comparison

Finns

Immigrants from Israel

Poor
Exceptional
21.5%
SINGLE FEMALE POVERTY
16.2/ 100
METRIC RATING
205th/ 347
METRIC RANK
18.3%
SINGLE FEMALE POVERTY
100.0/ 100
METRIC RATING
26th/ 347
METRIC RANK

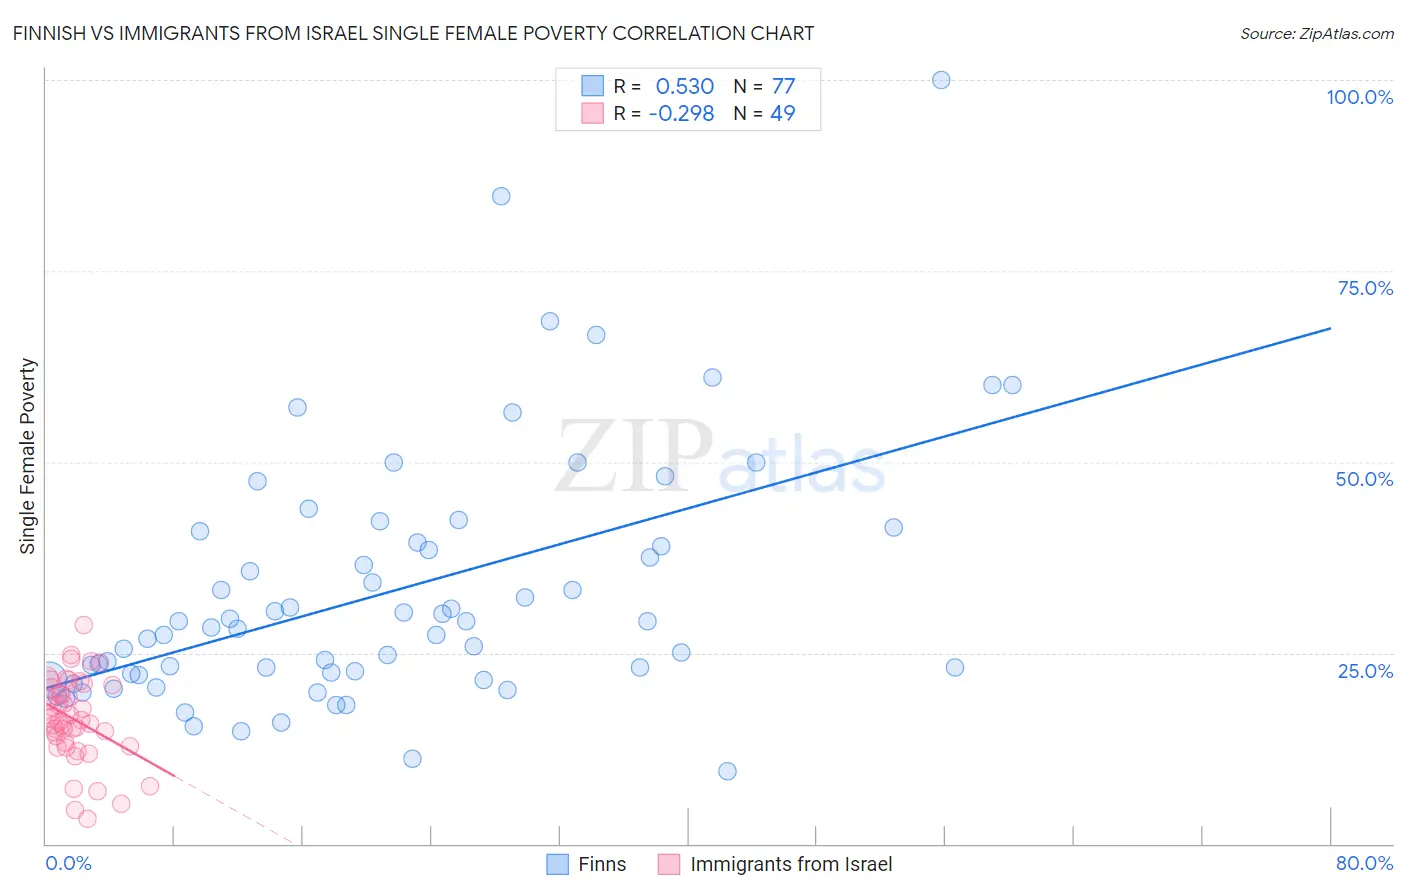
Finnish vs Immigrants from Israel Single Female Poverty Correlation Chart

The statistical analysis conducted on geographies consisting of 396,433,043 people shows a substantial positive correlation between the proportion of Finns and poverty level among single females in the United States with a correlation coefficient (R) of 0.530 and weighted average of 21.5%. Similarly, the statistical analysis conducted on geographies consisting of 207,619,232 people shows a weak negative correlation between the proportion of Immigrants from Israel and poverty level among single females in the United States with a correlation coefficient (R) of -0.298 and weighted average of 18.3%, a difference of 17.4%.
Finnish vs Immigrants from Israel Single Female Poverty

Single Female Poverty Correlation Summary

MeasurementFinnishImmigrants from Israel
Minimum9.5%3.3%
Maximum100.0%28.6%
Range90.5%25.2%
Mean33.0%16.3%
Median28.4%16.3%
Interquartile 25% (IQ1)22.2%13.0%
Interquartile 75% (IQ3)40.2%20.6%
Interquartile Range (IQR)18.0%7.6%
Standard Deviation (Sample)16.5%5.5%
Standard Deviation (Population)16.4%5.4%

Similar Demographics by Single Female Poverty

Demographics Similar to Finns by Single Female Poverty

In terms of single female poverty, the demographic groups most similar to Finns are Belgian (21.5%, a difference of 0.020%), Ghanaian (21.6%, a difference of 0.050%), Immigrants from Africa (21.5%, a difference of 0.060%), Haitian (21.6%, a difference of 0.090%), and Immigrants from Eastern Africa (21.6%, a difference of 0.12%).
DemographicsRating | RankSingle Female Poverty
Swiss
24.2
/100
|
#198
Fair
21.4%
Immigrants | Immigrants
22.0
/100
|
#199
Fair
21.4%
Irish
21.4
/100
|
#200
Fair
21.4%
Nigerians
20.9
/100
|
#201
Fair
21.4%
Immigrants | Kenya
20.7
/100
|
#202
Fair
21.4%
Immigrants | Haiti
18.8
/100
|
#203
Poor
21.5%
Immigrants | Africa
16.7
/100
|
#204
Poor
21.5%
Finns
16.2
/100
|
#205
Poor
21.5%
Belgians
16.1
/100
|
#206
Poor
21.5%
Ghanaians
15.7
/100
|
#207
Poor
21.6%
Haitians
15.4
/100
|
#208
Poor
21.6%
Immigrants | Eastern Africa
15.1
/100
|
#209
Poor
21.6%
Immigrants | Panama
14.4
/100
|
#210
Poor
21.6%
Icelanders
14.0
/100
|
#211
Poor
21.6%
Jamaicans
14.0
/100
|
#212
Poor
21.6%

Demographics Similar to Immigrants from Israel by Single Female Poverty

In terms of single female poverty, the demographic groups most similar to Immigrants from Israel are Immigrants from Singapore (18.3%, a difference of 0.020%), Armenian (18.3%, a difference of 0.12%), Immigrants from Pakistan (18.4%, a difference of 0.33%), Burmese (18.3%, a difference of 0.35%), and Asian (18.3%, a difference of 0.35%).
DemographicsRating | RankSingle Female Poverty
Immigrants | China
100.0
/100
|
#19
Exceptional
18.1%
Immigrants | Greece
100.0
/100
|
#20
Exceptional
18.3%
Maltese
100.0
/100
|
#21
Exceptional
18.3%
Burmese
100.0
/100
|
#22
Exceptional
18.3%
Asians
100.0
/100
|
#23
Exceptional
18.3%
Armenians
100.0
/100
|
#24
Exceptional
18.3%
Immigrants | Singapore
100.0
/100
|
#25
Exceptional
18.3%
Immigrants | Israel
100.0
/100
|
#26
Exceptional
18.3%
Immigrants | Pakistan
100.0
/100
|
#27
Exceptional
18.4%
Immigrants | Moldova
100.0
/100
|
#28
Exceptional
18.5%
Immigrants | Poland
100.0
/100
|
#29
Exceptional
18.5%
Immigrants | North Macedonia
99.9
/100
|
#30
Exceptional
18.5%
Immigrants | Asia
99.9
/100
|
#31
Exceptional
18.6%
Immigrants | Sri Lanka
99.9
/100
|
#32
Exceptional
18.6%
Immigrants | Philippines
99.9
/100
|
#33
Exceptional
18.6%