Finnish vs Immigrants from Israel Poverty

COMPARE

Finnish
Race
Ancestry
AfghanAfricanAlaska NativeAlaskan AthabascanAlbanianAleutAlsatianAmericanApacheArabArapahoArgentineanArmenianAssyrian/Chaldean/SyriacAustralianAustrianBahamianBangladeshiBarbadianBasqueBelgianBelizeanBermudanBhutaneseBlackfeetBolivianBrazilianBritishBritish West IndianBulgarianBurmeseCajunCambodianCanadianCape VerdeanCarpatho RusynCelticCentral AmericanCentral American IndianCherokeeCheyenneChickasawChileanChineseChippewaChoctawColombianColvilleComancheCosta RicanCreeCreekCroatianCrowCubanCypriotCzechCzechoslovakianDanishDelawareDominicanDutchDutch West IndianEastern EuropeanEcuadorianEgyptianEnglishEstonianEthiopianEuropeanFijianFilipinoFinnishFrenchFrench American IndianFrench CanadianGermanGerman RussianGhanaianGreekGuamanian/ChamorroGuatemalanGuyaneseHaitianHmongHonduranHopiHoumaHungarianIcelanderIndian (Asian)IndonesianInupiatIranianIraqiIrishIroquoisIsraeliItalianJamaicanJapaneseJordanianKenyanKiowaKoreanLaotianLatvianLebaneseLiberianLithuanianLumbeeLuxembourgerMacedonianMalaysianMalteseMarshalleseMenomineeMexicanMexican American IndianMongolianMoroccanNative HawaiianNavajoNepaleseNew ZealanderNicaraguanNigerianNorthern EuropeanNorwegianOkinawanOsageOttawaPaiutePakistaniPalestinianPanamanianParaguayanPennsylvania GermanPeruvianPimaPolishPortuguesePotawatomiPuebloPuerto RicanPuget Sound SalishRomanianRussianSalvadoranSamoanScandinavianScotch-IrishScottishSeminoleSenegaleseSerbianShoshoneSierra LeoneanSiouxSlavicSlovakSloveneSomaliSouth AfricanSouth AmericanSouth American IndianSoviet UnionSpaniardSpanishSpanish AmericanSpanish American IndianSri LankanSubsaharan AfricanSudaneseSwedishSwissSyrianTaiwaneseThaiTlingit-HaidaTohono O'OdhamTonganTrinidadian and TobagonianTsimshianTurkishU.S. Virgin IslanderUgandanUkrainianUruguayanUteVenezuelanVietnameseWelshWest IndianYakamaYaquiYugoslavianYumanYup'ikZimbabwean
Immigration
NonimmigrantsImmigrantsAfghanistanAfricaAlbaniaArgentinaArmeniaAsiaAustraliaAustriaBahamasBangladeshBarbadosBelarusBelgiumBelizeBoliviaBosnia and HerzegovinaBrazilBulgariaBurma/MyanmarCabo VerdeCambodiaCameroonCanadaCaribbeanCentral AmericaChileChinaColombiaCongoCosta RicaCroatiaCubaCzechoslovakiaDenmarkDominicaDominican RepublicEastern AfricaEastern AsiaEastern EuropeEcuadorEgyptEl SalvadorEnglandEritreaEthiopiaEuropeFijiFranceGermanyGhanaGreeceGrenadaGuatemalaGuyanaHaitiHondurasHong KongHungaryIndiaIndonesiaIranIraqIrelandItalyJamaicaJapanJordanKazakhstanKenyaKoreaKuwaitLaosLatin AmericaLatviaLebanonLiberiaLithuaniaMalaysiaMexicoMicronesiaMiddle AfricaMoldovaMoroccoNepalNetherlandsNicaraguaNigeriaNorth AmericaNorth MacedoniaNorthern AfricaNorthern EuropeNorwayOceaniaPakistanPanamaPeruPhilippinesPolandPortugalRomaniaRussiaSaudi ArabiaScotlandSenegalSerbiaSierra LeoneSingaporeSomaliaSouth AfricaSouth AmericaSouth Central AsiaSouth Eastern AsiaSouthern EuropeSpainSri LankaSt. Vincent and the GrenadinesSudanSwedenSwitzerlandSyriaTaiwanThailandTrinidad and TobagoTurkeyUgandaUkraineUruguayUzbekistanVenezuelaVietnamWest IndiesWestern AfricaWestern AsiaWestern EuropeYemenZaireZimbabweAzores
Immigrants from Israel
Race
Ancestry
AfghanAfricanAlaska NativeAlaskan AthabascanAlbanianAleutAlsatianAmericanApacheArabArapahoArgentineanArmenianAssyrian/Chaldean/SyriacAustralianAustrianBahamianBangladeshiBarbadianBasqueBelgianBelizeanBermudanBhutaneseBlackfeetBolivianBrazilianBritishBritish West IndianBulgarianBurmeseCajunCambodianCanadianCape VerdeanCarpatho RusynCelticCentral AmericanCentral American IndianCherokeeCheyenneChickasawChileanChineseChippewaChoctawColombianColvilleComancheCosta RicanCreeCreekCroatianCrowCubanCypriotCzechCzechoslovakianDanishDelawareDominicanDutchDutch West IndianEastern EuropeanEcuadorianEgyptianEnglishEstonianEthiopianEuropeanFijianFilipinoFrenchFrench American IndianFrench CanadianGermanGerman RussianGhanaianGreekGuamanian/ChamorroGuatemalanGuyaneseHaitianHmongHonduranHopiHoumaHungarianIcelanderIndian (Asian)IndonesianInupiatIranianIraqiIrishIroquoisIsraeliItalianJamaicanJapaneseJordanianKenyanKiowaKoreanLaotianLatvianLebaneseLiberianLithuanianLumbeeLuxembourgerMacedonianMalaysianMalteseMarshalleseMenomineeMexicanMexican American IndianMongolianMoroccanNative HawaiianNavajoNepaleseNew ZealanderNicaraguanNigerianNorthern EuropeanNorwegianOkinawanOsageOttawaPaiutePakistaniPalestinianPanamanianParaguayanPennsylvania GermanPeruvianPimaPolishPortuguesePotawatomiPuebloPuerto RicanPuget Sound SalishRomanianRussianSalvadoranSamoanScandinavianScotch-IrishScottishSeminoleSenegaleseSerbianShoshoneSierra LeoneanSiouxSlavicSlovakSloveneSomaliSouth AfricanSouth AmericanSouth American IndianSoviet UnionSpaniardSpanishSpanish AmericanSpanish American IndianSri LankanSubsaharan AfricanSudaneseSwedishSwissSyrianTaiwaneseThaiTlingit-HaidaTohono O'OdhamTonganTrinidadian and TobagonianTsimshianTurkishU.S. Virgin IslanderUgandanUkrainianUruguayanUteVenezuelanVietnameseWelshWest IndianYakamaYaquiYugoslavianYumanYup'ikZimbabwean
Immigration
NonimmigrantsImmigrantsAfghanistanAfricaAlbaniaArgentinaArmeniaAsiaAustraliaAustriaBahamasBangladeshBarbadosBelarusBelgiumBelizeBoliviaBosnia and HerzegovinaBrazilBulgariaBurma/MyanmarCabo VerdeCambodiaCameroonCanadaCaribbeanCentral AmericaChileChinaColombiaCongoCosta RicaCroatiaCubaCzechoslovakiaDenmarkDominicaDominican RepublicEastern AfricaEastern AsiaEastern EuropeEcuadorEgyptEl SalvadorEnglandEritreaEthiopiaEuropeFijiFranceGermanyGhanaGreeceGrenadaGuatemalaGuyanaHaitiHondurasHong KongHungaryIndiaIndonesiaIranIraqIrelandIsraelItalyJamaicaJapanJordanKazakhstanKenyaKoreaKuwaitLaosLatin AmericaLatviaLebanonLiberiaLithuaniaMalaysiaMexicoMicronesiaMiddle AfricaMoldovaMoroccoNepalNetherlandsNicaraguaNigeriaNorth AmericaNorth MacedoniaNorthern AfricaNorthern EuropeNorwayOceaniaPakistanPanamaPeruPhilippinesPolandPortugalRomaniaRussiaSaudi ArabiaScotlandSenegalSerbiaSierra LeoneSingaporeSomaliaSouth AfricaSouth AmericaSouth Central AsiaSouth Eastern AsiaSouthern EuropeSpainSri LankaSt. Vincent and the GrenadinesSudanSwedenSwitzerlandSyriaTaiwanThailandTrinidad and TobagoTurkeyUgandaUkraineUruguayUzbekistanVenezuelaVietnamWest IndiesWestern AfricaWestern AsiaWestern EuropeYemenZaireZimbabweAzores
Poverty
Income
Poverty
Unemployment
Labor Participation
Family Structure
Vehicle Availability
Education Level
Disability

Poverty Comparison

Finns

Immigrants from Israel

Exceptional
Excellent
11.4%
POVERTY
95.2/ 100
METRIC RATING
91st/ 347
METRIC RANK
11.7%
POVERTY
87.4/ 100
METRIC RATING
128th/ 347
METRIC RANK

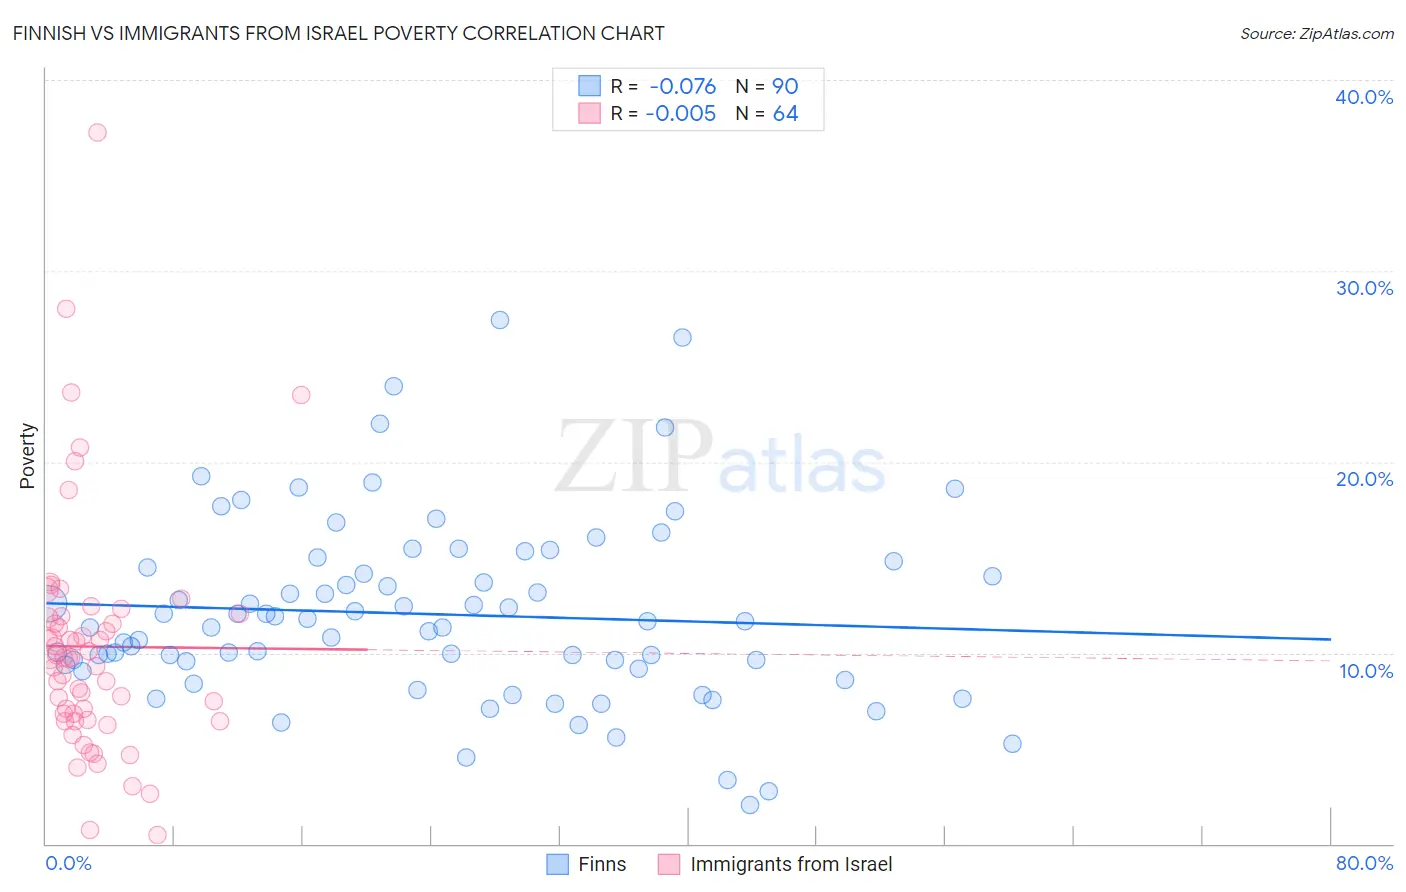
Finnish vs Immigrants from Israel Poverty Correlation Chart

The statistical analysis conducted on geographies consisting of 404,501,473 people shows a slight negative correlation between the proportion of Finns and poverty level in the United States with a correlation coefficient (R) of -0.076 and weighted average of 11.4%. Similarly, the statistical analysis conducted on geographies consisting of 209,974,563 people shows no correlation between the proportion of Immigrants from Israel and poverty level in the United States with a correlation coefficient (R) of -0.005 and weighted average of 11.7%, a difference of 2.8%.
Finnish vs Immigrants from Israel Poverty

Poverty Correlation Summary

MeasurementFinnishImmigrants from Israel
Minimum2.0%0.47%
Maximum27.4%37.3%
Range25.4%36.8%
Mean12.0%10.3%
Median11.5%9.7%
Interquartile 25% (IQ1)9.4%6.6%
Interquartile 75% (IQ3)14.5%11.9%
Interquartile Range (IQR)5.1%5.2%
Standard Deviation (Sample)4.8%6.2%
Standard Deviation (Population)4.8%6.1%

Similar Demographics by Poverty

Demographics Similar to Finns by Poverty

In terms of poverty, the demographic groups most similar to Finns are Immigrants from Denmark (11.4%, a difference of 0.13%), British (11.4%, a difference of 0.14%), Romanian (11.4%, a difference of 0.17%), Paraguayan (11.4%, a difference of 0.19%), and Australian (11.4%, a difference of 0.20%).
DemographicsRating | RankPoverty
English
96.3
/100
|
#84
Exceptional
11.3%
Immigrants | England
96.2
/100
|
#85
Exceptional
11.4%
Jordanians
96.0
/100
|
#86
Exceptional
11.4%
Northern Europeans
96.0
/100
|
#87
Exceptional
11.4%
Belgians
95.8
/100
|
#88
Exceptional
11.4%
Czechoslovakians
95.7
/100
|
#89
Exceptional
11.4%
Immigrants | Denmark
95.5
/100
|
#90
Exceptional
11.4%
Finns
95.2
/100
|
#91
Exceptional
11.4%
British
95.0
/100
|
#92
Exceptional
11.4%
Romanians
94.9
/100
|
#93
Exceptional
11.4%
Paraguayans
94.9
/100
|
#94
Exceptional
11.4%
Australians
94.9
/100
|
#95
Exceptional
11.4%
Immigrants | South Africa
94.7
/100
|
#96
Exceptional
11.5%
Immigrants | Egypt
94.6
/100
|
#97
Exceptional
11.5%
Immigrants | Latvia
94.5
/100
|
#98
Exceptional
11.5%

Demographics Similar to Immigrants from Israel by Poverty

In terms of poverty, the demographic groups most similar to Immigrants from Israel are South African (11.7%, a difference of 0.090%), Immigrants from Argentina (11.7%, a difference of 0.13%), Immigrants from Norway (11.7%, a difference of 0.14%), Immigrants from Brazil (11.7%, a difference of 0.18%), and Immigrants from Ukraine (11.8%, a difference of 0.19%).
DemographicsRating | RankPoverty
New Zealanders
88.7
/100
|
#121
Excellent
11.7%
Puget Sound Salish
88.7
/100
|
#122
Excellent
11.7%
Immigrants | Hungary
88.6
/100
|
#123
Excellent
11.7%
Soviet Union
88.4
/100
|
#124
Excellent
11.7%
Immigrants | Brazil
88.2
/100
|
#125
Excellent
11.7%
Immigrants | Norway
88.0
/100
|
#126
Excellent
11.7%
Immigrants | Argentina
88.0
/100
|
#127
Excellent
11.7%
Immigrants | Israel
87.4
/100
|
#128
Excellent
11.7%
South Africans
87.0
/100
|
#129
Excellent
11.7%
Immigrants | Ukraine
86.6
/100
|
#130
Excellent
11.8%
French
86.1
/100
|
#131
Excellent
11.8%
Peruvians
85.6
/100
|
#132
Excellent
11.8%
Immigrants | Western Europe
85.2
/100
|
#133
Excellent
11.8%
Yugoslavians
85.2
/100
|
#134
Excellent
11.8%
Immigrants | Vietnam
85.2
/100
|
#135
Excellent
11.8%