Finnish vs Immigrants from Switzerland Single Female Poverty
COMPARE
Finnish
Immigrants from Switzerland
Single Female Poverty
Single Female Poverty Comparison
Finns
Immigrants from Switzerland
21.5%
SINGLE FEMALE POVERTY
16.2/ 100
METRIC RATING
205th/ 347
METRIC RANK
20.0%
SINGLE FEMALE POVERTY
95.1/ 100
METRIC RATING
121st/ 347
METRIC RANK
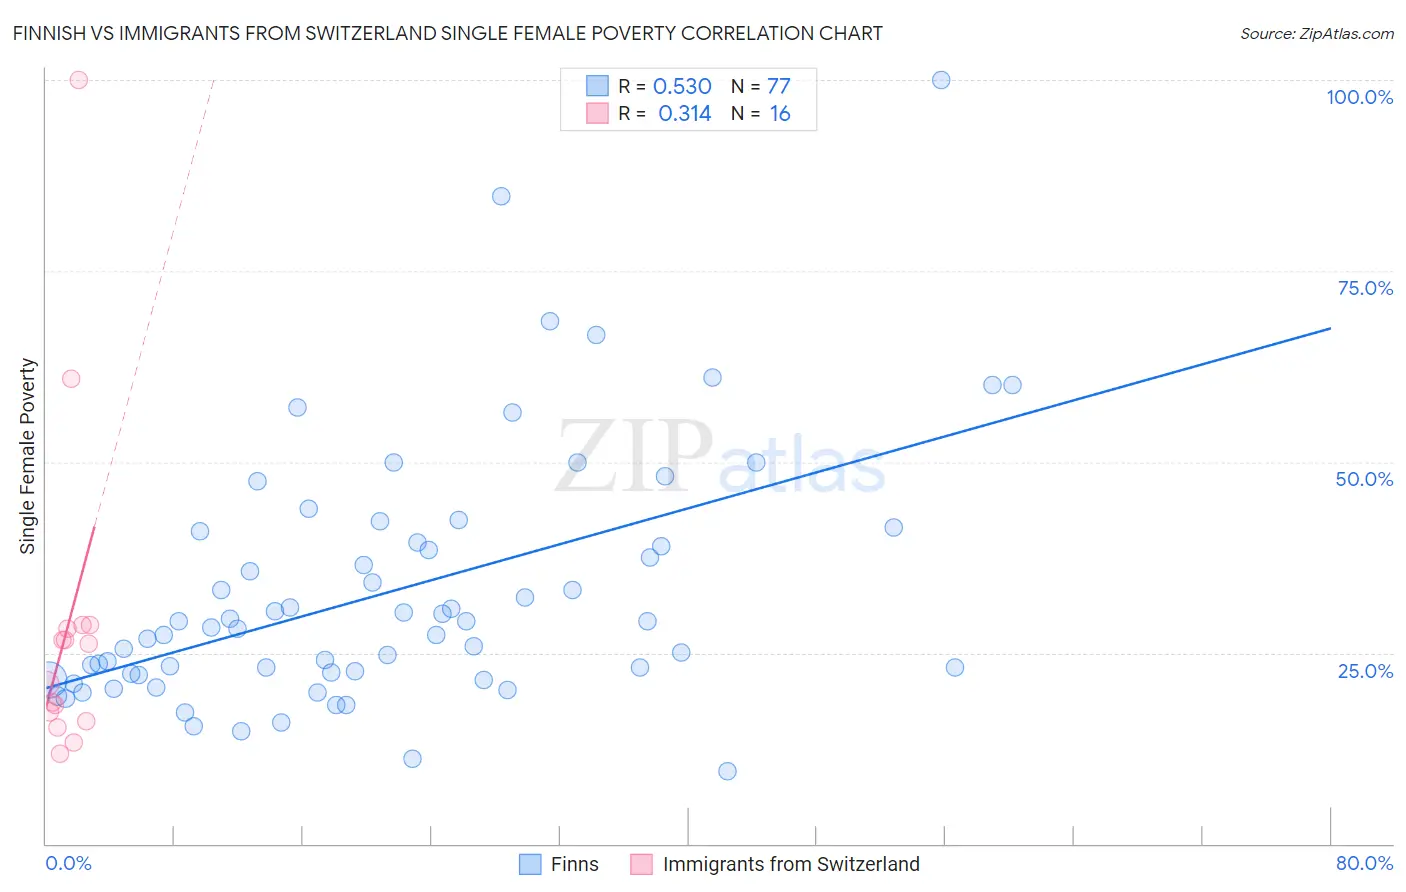
Finnish vs Immigrants from Switzerland Single Female Poverty Correlation Chart
The statistical analysis conducted on geographies consisting of 396,433,043 people shows a substantial positive correlation between the proportion of Finns and poverty level among single females in the United States with a correlation coefficient (R) of 0.530 and weighted average of 21.5%. Similarly, the statistical analysis conducted on geographies consisting of 146,751,859 people shows a mild positive correlation between the proportion of Immigrants from Switzerland and poverty level among single females in the United States with a correlation coefficient (R) of 0.314 and weighted average of 20.0%, a difference of 7.5%.
Single Female Poverty Correlation Summary
| Measurement | Finnish | Immigrants from Switzerland |
| Minimum | 9.5% | 11.7% |
| Maximum | 100.0% | 100.0% |
| Range | 90.5% | 88.3% |
| Mean | 33.0% | 28.5% |
| Median | 28.4% | 23.5% |
| Interquartile 25% (IQ1) | 22.2% | 16.6% |
| Interquartile 75% (IQ3) | 40.2% | 28.3% |
| Interquartile Range (IQR) | 18.0% | 11.7% |
| Standard Deviation (Sample) | 16.5% | 22.2% |
| Standard Deviation (Population) | 16.4% | 21.5% |
Similar Demographics by Single Female Poverty
Demographics Similar to Finns by Single Female Poverty
In terms of single female poverty, the demographic groups most similar to Finns are Belgian (21.5%, a difference of 0.020%), Ghanaian (21.6%, a difference of 0.050%), Immigrants from Africa (21.5%, a difference of 0.060%), Haitian (21.6%, a difference of 0.090%), and Immigrants from Eastern Africa (21.6%, a difference of 0.12%).
| Demographics | Rating | Rank | Single Female Poverty |
| Swiss | 24.2 /100 | #198 | Fair 21.4% |
| Immigrants | Immigrants | 22.0 /100 | #199 | Fair 21.4% |
| Irish | 21.4 /100 | #200 | Fair 21.4% |
| Nigerians | 20.9 /100 | #201 | Fair 21.4% |
| Immigrants | Kenya | 20.7 /100 | #202 | Fair 21.4% |
| Immigrants | Haiti | 18.8 /100 | #203 | Poor 21.5% |
| Immigrants | Africa | 16.7 /100 | #204 | Poor 21.5% |
| Finns | 16.2 /100 | #205 | Poor 21.5% |
| Belgians | 16.1 /100 | #206 | Poor 21.5% |
| Ghanaians | 15.7 /100 | #207 | Poor 21.6% |
| Haitians | 15.4 /100 | #208 | Poor 21.6% |
| Immigrants | Eastern Africa | 15.1 /100 | #209 | Poor 21.6% |
| Immigrants | Panama | 14.4 /100 | #210 | Poor 21.6% |
| Icelanders | 14.0 /100 | #211 | Poor 21.6% |
| Jamaicans | 14.0 /100 | #212 | Poor 21.6% |
Demographics Similar to Immigrants from Switzerland by Single Female Poverty
In terms of single female poverty, the demographic groups most similar to Immigrants from Switzerland are South American (20.0%, a difference of 0.030%), Immigrants from South America (20.0%, a difference of 0.030%), Immigrants from Afghanistan (20.0%, a difference of 0.13%), Immigrants from Ethiopia (20.0%, a difference of 0.13%), and Polish (20.0%, a difference of 0.20%).
| Demographics | Rating | Rank | Single Female Poverty |
| Immigrants | Colombia | 95.9 /100 | #114 | Exceptional 20.0% |
| Immigrants | Northern Africa | 95.8 /100 | #115 | Exceptional 20.0% |
| Immigrants | Kazakhstan | 95.7 /100 | #116 | Exceptional 20.0% |
| Poles | 95.6 /100 | #117 | Exceptional 20.0% |
| Immigrants | Afghanistan | 95.4 /100 | #118 | Exceptional 20.0% |
| Immigrants | Ethiopia | 95.4 /100 | #119 | Exceptional 20.0% |
| South Americans | 95.1 /100 | #120 | Exceptional 20.0% |
| Immigrants | Switzerland | 95.1 /100 | #121 | Exceptional 20.0% |
| Immigrants | South America | 95.0 /100 | #122 | Exceptional 20.0% |
| Brazilians | 94.4 /100 | #123 | Exceptional 20.1% |
| Immigrants | Chile | 94.3 /100 | #124 | Exceptional 20.1% |
| Immigrants | South Africa | 93.9 /100 | #125 | Exceptional 20.1% |
| Serbians | 93.3 /100 | #126 | Exceptional 20.1% |
| Mongolians | 93.2 /100 | #127 | Exceptional 20.2% |
| Immigrants | Spain | 92.7 /100 | #128 | Exceptional 20.2% |