Finnish vs Filipino Female Poverty Among 18-24 Year Olds
COMPARE
Finnish
Filipino
Female Poverty Among 18-24 Year Olds
Female Poverty Among 18-24 Year Olds Comparison
Finns
Filipinos
20.8%
FEMALE POVERTY AMONG 18-24 YEAR OLDS
6.0/ 100
METRIC RATING
232nd/ 347
METRIC RANK
19.0%
FEMALE POVERTY AMONG 18-24 YEAR OLDS
98.9/ 100
METRIC RATING
92nd/ 347
METRIC RANK
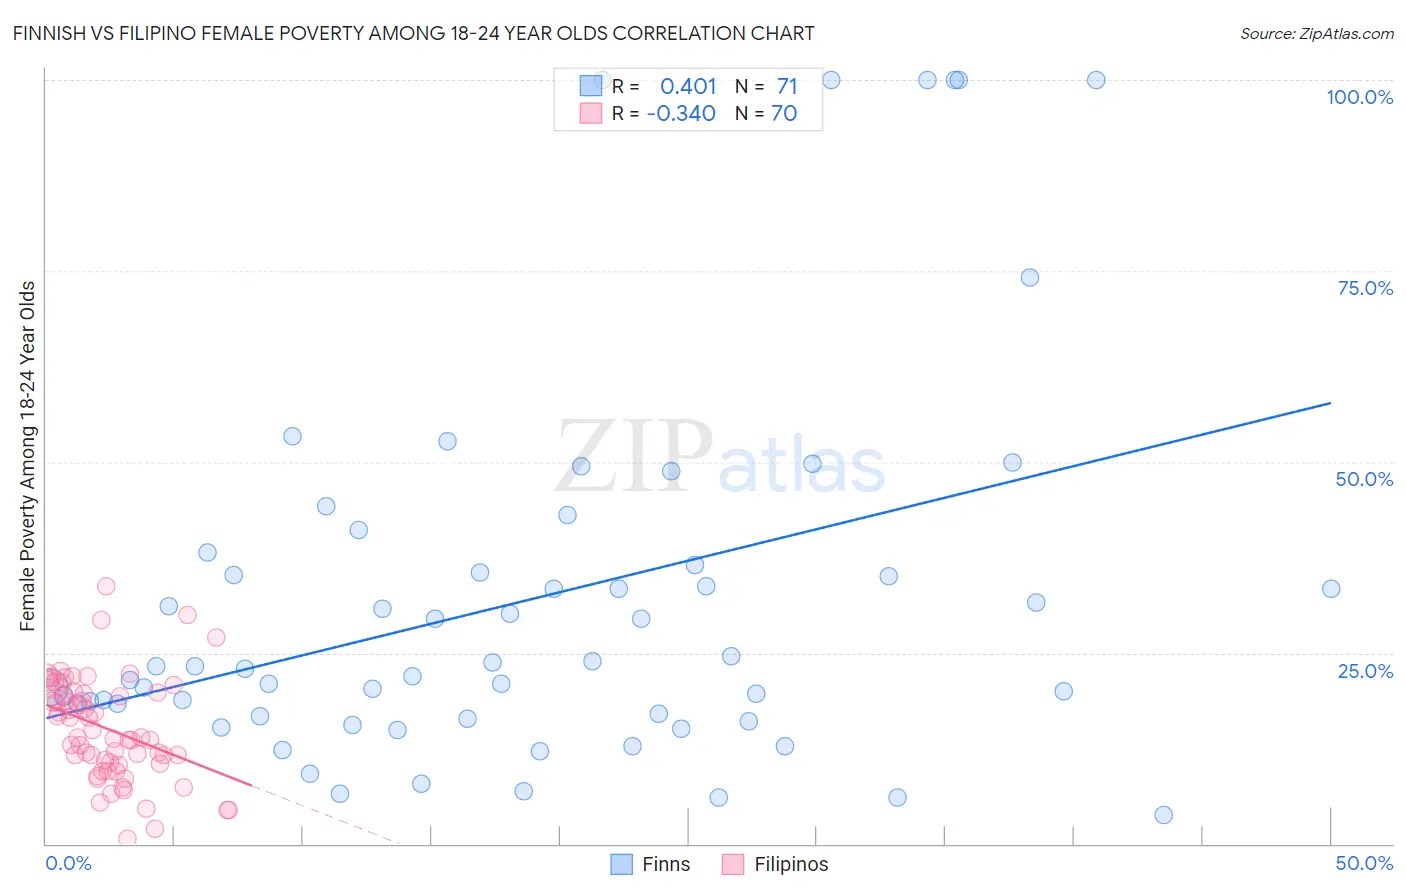
Finnish vs Filipino Female Poverty Among 18-24 Year Olds Correlation Chart
The statistical analysis conducted on geographies consisting of 390,891,764 people shows a moderate positive correlation between the proportion of Finns and poverty level among females between the ages 18 and 24 in the United States with a correlation coefficient (R) of 0.401 and weighted average of 20.8%. Similarly, the statistical analysis conducted on geographies consisting of 250,130,110 people shows a mild negative correlation between the proportion of Filipinos and poverty level among females between the ages 18 and 24 in the United States with a correlation coefficient (R) of -0.340 and weighted average of 19.0%, a difference of 9.4%.
Female Poverty Among 18-24 Year Olds Correlation Summary
| Measurement | Finnish | Filipino |
| Minimum | 3.8% | 0.62% |
| Maximum | 100.0% | 33.7% |
| Range | 96.2% | 33.1% |
| Mean | 31.9% | 15.0% |
| Median | 23.2% | 14.0% |
| Interquartile 25% (IQ1) | 16.7% | 10.5% |
| Interquartile 75% (IQ3) | 36.5% | 19.9% |
| Interquartile Range (IQR) | 19.8% | 9.4% |
| Standard Deviation (Sample) | 24.7% | 6.7% |
| Standard Deviation (Population) | 24.6% | 6.7% |
Similar Demographics by Female Poverty Among 18-24 Year Olds
Demographics Similar to Finns by Female Poverty Among 18-24 Year Olds
In terms of female poverty among 18-24 year olds, the demographic groups most similar to Finns are Immigrants from St. Vincent and the Grenadines (20.8%, a difference of 0.0%), Australian (20.8%, a difference of 0.030%), White/Caucasian (20.8%, a difference of 0.030%), Immigrants from Denmark (20.8%, a difference of 0.030%), and Ghanaian (20.8%, a difference of 0.10%).
| Demographics | Rating | Rank | Female Poverty Among 18-24 Year Olds |
| Norwegians | 7.3 /100 | #225 | Tragic 20.7% |
| Estonians | 7.2 /100 | #226 | Tragic 20.7% |
| Immigrants | Sweden | 6.8 /100 | #227 | Tragic 20.7% |
| Ghanaians | 6.5 /100 | #228 | Tragic 20.8% |
| Australians | 6.1 /100 | #229 | Tragic 20.8% |
| Whites/Caucasians | 6.1 /100 | #230 | Tragic 20.8% |
| Immigrants | St. Vincent and the Grenadines | 6.0 /100 | #231 | Tragic 20.8% |
| Finns | 6.0 /100 | #232 | Tragic 20.8% |
| Immigrants | Denmark | 5.8 /100 | #233 | Tragic 20.8% |
| Welsh | 5.4 /100 | #234 | Tragic 20.8% |
| Immigrants | Uganda | 5.1 /100 | #235 | Tragic 20.8% |
| Okinawans | 4.9 /100 | #236 | Tragic 20.8% |
| Scottish | 4.5 /100 | #237 | Tragic 20.9% |
| Immigrants | Singapore | 4.4 /100 | #238 | Tragic 20.9% |
| Immigrants | Guatemala | 4.3 /100 | #239 | Tragic 20.9% |
Demographics Similar to Filipinos by Female Poverty Among 18-24 Year Olds
In terms of female poverty among 18-24 year olds, the demographic groups most similar to Filipinos are Haitian (19.0%, a difference of 0.030%), Romanian (19.0%, a difference of 0.050%), Ukrainian (19.0%, a difference of 0.080%), Afghan (19.0%, a difference of 0.14%), and Guamanian/Chamorro (19.0%, a difference of 0.16%).
| Demographics | Rating | Rank | Female Poverty Among 18-24 Year Olds |
| Immigrants | Armenia | 99.2 /100 | #85 | Exceptional 18.9% |
| Immigrants | Iraq | 99.2 /100 | #86 | Exceptional 18.9% |
| Immigrants | Jamaica | 99.2 /100 | #87 | Exceptional 18.9% |
| Croatians | 99.1 /100 | #88 | Exceptional 19.0% |
| Immigrants | Cabo Verde | 99.0 /100 | #89 | Exceptional 19.0% |
| Afghans | 99.0 /100 | #90 | Exceptional 19.0% |
| Romanians | 98.9 /100 | #91 | Exceptional 19.0% |
| Filipinos | 98.9 /100 | #92 | Exceptional 19.0% |
| Haitians | 98.9 /100 | #93 | Exceptional 19.0% |
| Ukrainians | 98.8 /100 | #94 | Exceptional 19.0% |
| Guamanians/Chamorros | 98.8 /100 | #95 | Exceptional 19.0% |
| Sierra Leoneans | 98.7 /100 | #96 | Exceptional 19.0% |
| Salvadorans | 98.4 /100 | #97 | Exceptional 19.1% |
| Immigrants | Jordan | 98.4 /100 | #98 | Exceptional 19.1% |
| Immigrants | Czechoslovakia | 98.3 /100 | #99 | Exceptional 19.1% |