Latvian vs Filipino Female Poverty Among 18-24 Year Olds
COMPARE
Latvian
Filipino
Female Poverty Among 18-24 Year Olds
Female Poverty Among 18-24 Year Olds Comparison
Latvians
Filipinos
19.5%
FEMALE POVERTY AMONG 18-24 YEAR OLDS
92.7/ 100
METRIC RATING
131st/ 347
METRIC RANK
19.0%
FEMALE POVERTY AMONG 18-24 YEAR OLDS
98.9/ 100
METRIC RATING
92nd/ 347
METRIC RANK
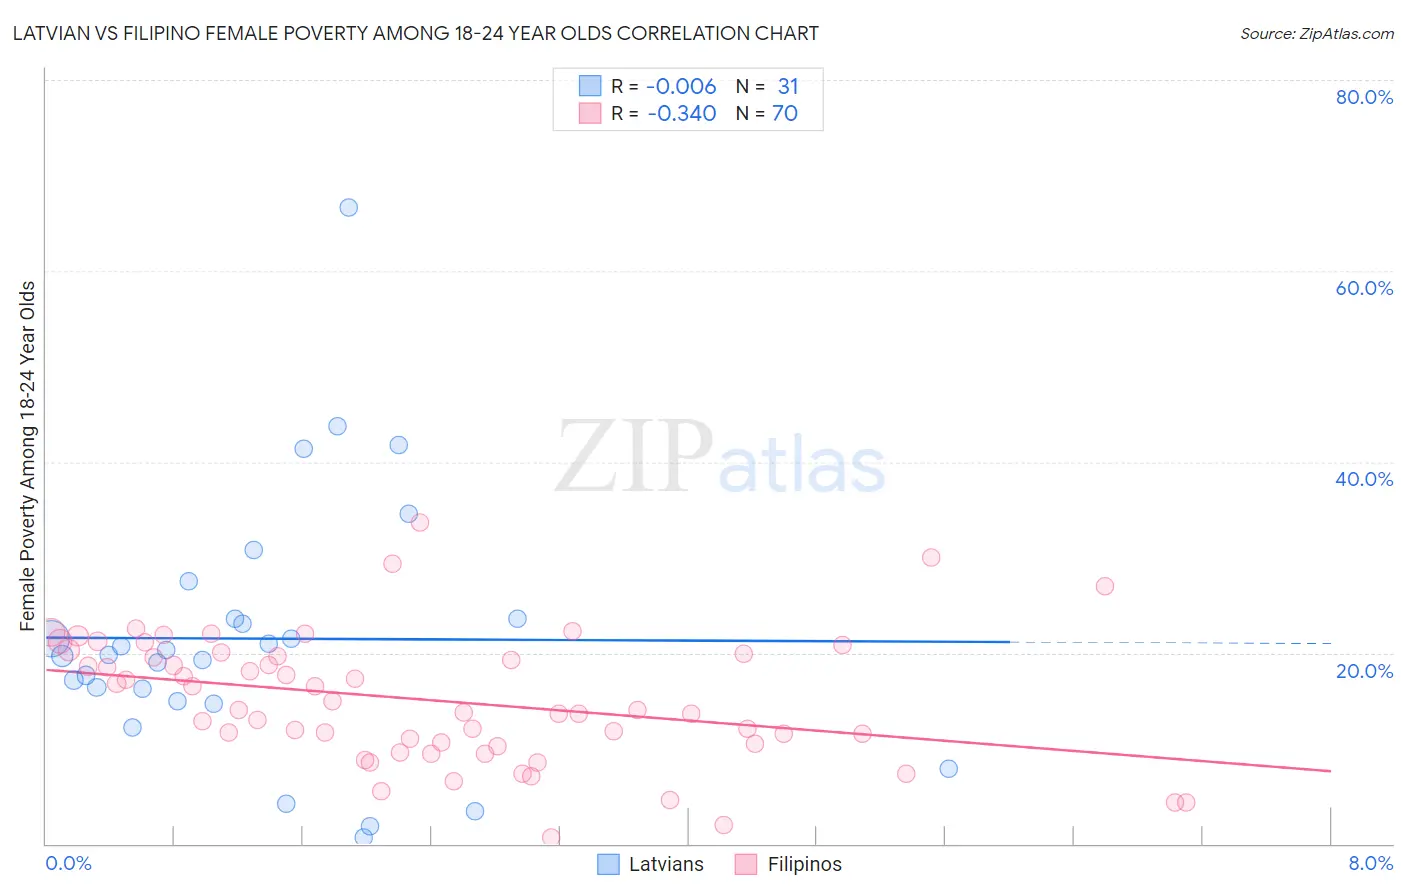
Latvian vs Filipino Female Poverty Among 18-24 Year Olds Correlation Chart
The statistical analysis conducted on geographies consisting of 216,394,017 people shows no correlation between the proportion of Latvians and poverty level among females between the ages 18 and 24 in the United States with a correlation coefficient (R) of -0.006 and weighted average of 19.5%. Similarly, the statistical analysis conducted on geographies consisting of 250,130,110 people shows a mild negative correlation between the proportion of Filipinos and poverty level among females between the ages 18 and 24 in the United States with a correlation coefficient (R) of -0.340 and weighted average of 19.0%, a difference of 2.5%.
Female Poverty Among 18-24 Year Olds Correlation Summary
| Measurement | Latvian | Filipino |
| Minimum | 0.67% | 0.62% |
| Maximum | 66.7% | 33.7% |
| Range | 66.0% | 33.1% |
| Mean | 21.5% | 15.0% |
| Median | 19.7% | 14.0% |
| Interquartile 25% (IQ1) | 15.0% | 10.5% |
| Interquartile 75% (IQ3) | 23.5% | 19.9% |
| Interquartile Range (IQR) | 8.6% | 9.4% |
| Standard Deviation (Sample) | 13.6% | 6.7% |
| Standard Deviation (Population) | 13.4% | 6.7% |
Similar Demographics by Female Poverty Among 18-24 Year Olds
Demographics Similar to Latvians by Female Poverty Among 18-24 Year Olds
In terms of female poverty among 18-24 year olds, the demographic groups most similar to Latvians are Slovak (19.5%, a difference of 0.040%), Immigrants from England (19.5%, a difference of 0.040%), Immigrants from Canada (19.5%, a difference of 0.040%), Jamaican (19.5%, a difference of 0.10%), and Turkish (19.5%, a difference of 0.11%).
| Demographics | Rating | Rank | Female Poverty Among 18-24 Year Olds |
| Immigrants | Chile | 94.3 /100 | #124 | Exceptional 19.4% |
| Immigrants | Panama | 94.0 /100 | #125 | Exceptional 19.4% |
| Immigrants | Russia | 93.7 /100 | #126 | Exceptional 19.4% |
| Cape Verdeans | 93.6 /100 | #127 | Exceptional 19.4% |
| Slovaks | 92.9 /100 | #128 | Exceptional 19.5% |
| Immigrants | England | 92.9 /100 | #129 | Exceptional 19.5% |
| Immigrants | Canada | 92.9 /100 | #130 | Exceptional 19.5% |
| Latvians | 92.7 /100 | #131 | Exceptional 19.5% |
| Jamaicans | 92.1 /100 | #132 | Exceptional 19.5% |
| Turks | 92.1 /100 | #133 | Exceptional 19.5% |
| Immigrants | North America | 92.1 /100 | #134 | Exceptional 19.5% |
| Soviet Union | 92.0 /100 | #135 | Exceptional 19.5% |
| Russians | 91.5 /100 | #136 | Exceptional 19.5% |
| Austrians | 90.7 /100 | #137 | Exceptional 19.5% |
| Immigrants | Morocco | 89.9 /100 | #138 | Excellent 19.6% |
Demographics Similar to Filipinos by Female Poverty Among 18-24 Year Olds
In terms of female poverty among 18-24 year olds, the demographic groups most similar to Filipinos are Haitian (19.0%, a difference of 0.030%), Romanian (19.0%, a difference of 0.050%), Ukrainian (19.0%, a difference of 0.080%), Afghan (19.0%, a difference of 0.14%), and Guamanian/Chamorro (19.0%, a difference of 0.16%).
| Demographics | Rating | Rank | Female Poverty Among 18-24 Year Olds |
| Immigrants | Armenia | 99.2 /100 | #85 | Exceptional 18.9% |
| Immigrants | Iraq | 99.2 /100 | #86 | Exceptional 18.9% |
| Immigrants | Jamaica | 99.2 /100 | #87 | Exceptional 18.9% |
| Croatians | 99.1 /100 | #88 | Exceptional 19.0% |
| Immigrants | Cabo Verde | 99.0 /100 | #89 | Exceptional 19.0% |
| Afghans | 99.0 /100 | #90 | Exceptional 19.0% |
| Romanians | 98.9 /100 | #91 | Exceptional 19.0% |
| Filipinos | 98.9 /100 | #92 | Exceptional 19.0% |
| Haitians | 98.9 /100 | #93 | Exceptional 19.0% |
| Ukrainians | 98.8 /100 | #94 | Exceptional 19.0% |
| Guamanians/Chamorros | 98.8 /100 | #95 | Exceptional 19.0% |
| Sierra Leoneans | 98.7 /100 | #96 | Exceptional 19.0% |
| Salvadorans | 98.4 /100 | #97 | Exceptional 19.1% |
| Immigrants | Jordan | 98.4 /100 | #98 | Exceptional 19.1% |
| Immigrants | Czechoslovakia | 98.3 /100 | #99 | Exceptional 19.1% |