Fijian vs Immigrants from Zimbabwe Single Male Poverty
COMPARE
Fijian
Immigrants from Zimbabwe
Single Male Poverty
Single Male Poverty Comparison
Fijians
Immigrants from Zimbabwe
13.8%
SINGLE MALE POVERTY
0.3/ 100
METRIC RATING
262nd/ 347
METRIC RANK
12.6%
SINGLE MALE POVERTY
78.0/ 100
METRIC RATING
140th/ 347
METRIC RANK
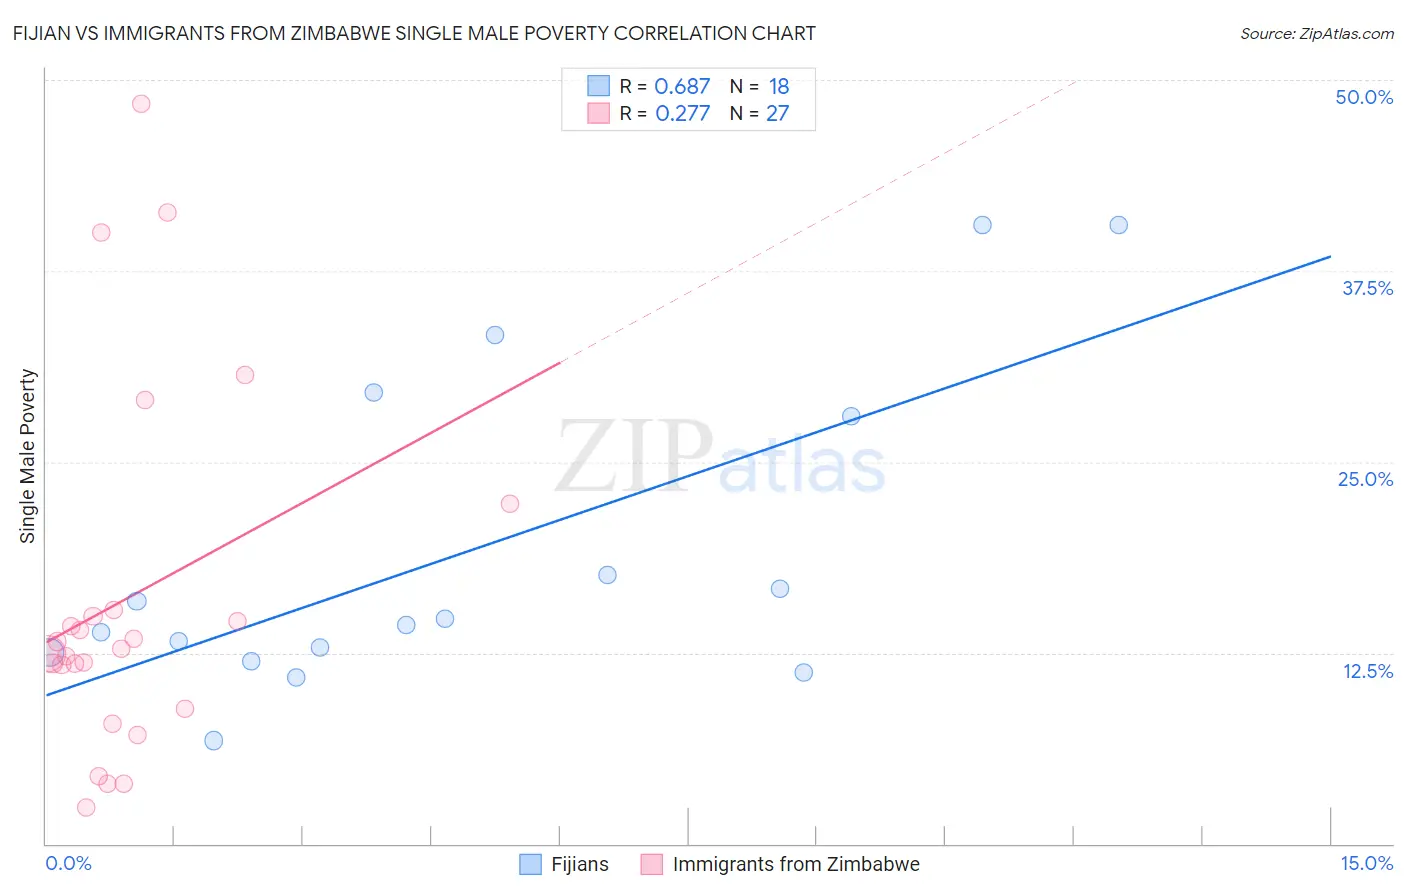
Fijian vs Immigrants from Zimbabwe Single Male Poverty Correlation Chart
The statistical analysis conducted on geographies consisting of 54,470,784 people shows a significant positive correlation between the proportion of Fijians and poverty level among single males in the United States with a correlation coefficient (R) of 0.687 and weighted average of 13.8%. Similarly, the statistical analysis conducted on geographies consisting of 112,161,655 people shows a weak positive correlation between the proportion of Immigrants from Zimbabwe and poverty level among single males in the United States with a correlation coefficient (R) of 0.277 and weighted average of 12.6%, a difference of 9.7%.
Single Male Poverty Correlation Summary
| Measurement | Fijian | Immigrants from Zimbabwe |
| Minimum | 6.8% | 2.3% |
| Maximum | 40.5% | 48.4% |
| Range | 33.8% | 46.1% |
| Mean | 19.1% | 16.1% |
| Median | 14.5% | 12.7% |
| Interquartile 25% (IQ1) | 12.5% | 8.9% |
| Interquartile 75% (IQ3) | 28.0% | 15.3% |
| Interquartile Range (IQR) | 15.5% | 6.4% |
| Standard Deviation (Sample) | 10.4% | 11.8% |
| Standard Deviation (Population) | 10.1% | 11.6% |
Similar Demographics by Single Male Poverty
Demographics Similar to Fijians by Single Male Poverty
In terms of single male poverty, the demographic groups most similar to Fijians are Cape Verdean (13.8%, a difference of 0.12%), Hungarian (13.8%, a difference of 0.17%), Swiss (13.8%, a difference of 0.22%), Guatemalan (13.8%, a difference of 0.29%), and West Indian (13.8%, a difference of 0.31%).
| Demographics | Rating | Rank | Single Male Poverty |
| Spaniards | 0.4 /100 | #255 | Tragic 13.7% |
| Immigrants | Belize | 0.4 /100 | #256 | Tragic 13.7% |
| Immigrants | Central America | 0.3 /100 | #257 | Tragic 13.8% |
| Immigrants | Guatemala | 0.3 /100 | #258 | Tragic 13.8% |
| Guatemalans | 0.3 /100 | #259 | Tragic 13.8% |
| Swiss | 0.3 /100 | #260 | Tragic 13.8% |
| Hungarians | 0.3 /100 | #261 | Tragic 13.8% |
| Fijians | 0.3 /100 | #262 | Tragic 13.8% |
| Cape Verdeans | 0.2 /100 | #263 | Tragic 13.8% |
| West Indians | 0.2 /100 | #264 | Tragic 13.8% |
| Immigrants | Congo | 0.2 /100 | #265 | Tragic 13.9% |
| Immigrants | Cabo Verde | 0.1 /100 | #266 | Tragic 13.9% |
| Germans | 0.1 /100 | #267 | Tragic 13.9% |
| Immigrants | Mexico | 0.1 /100 | #268 | Tragic 13.9% |
| Scottish | 0.1 /100 | #269 | Tragic 14.0% |
Demographics Similar to Immigrants from Zimbabwe by Single Male Poverty
In terms of single male poverty, the demographic groups most similar to Immigrants from Zimbabwe are Cuban (12.6%, a difference of 0.15%), Immigrants from El Salvador (12.6%, a difference of 0.16%), Okinawan (12.6%, a difference of 0.16%), Immigrants from Uganda (12.6%, a difference of 0.16%), and Immigrants from France (12.6%, a difference of 0.17%).
| Demographics | Rating | Rank | Single Male Poverty |
| Immigrants | Western Asia | 83.4 /100 | #133 | Excellent 12.5% |
| Immigrants | Ecuador | 82.1 /100 | #134 | Excellent 12.5% |
| Immigrants | Costa Rica | 81.9 /100 | #135 | Excellent 12.5% |
| Immigrants | Austria | 81.9 /100 | #136 | Excellent 12.5% |
| Ukrainians | 80.7 /100 | #137 | Excellent 12.6% |
| Immigrants | El Salvador | 80.0 /100 | #138 | Excellent 12.6% |
| Cubans | 79.9 /100 | #139 | Good 12.6% |
| Immigrants | Zimbabwe | 78.0 /100 | #140 | Good 12.6% |
| Okinawans | 75.9 /100 | #141 | Good 12.6% |
| Immigrants | Uganda | 75.9 /100 | #142 | Good 12.6% |
| Immigrants | France | 75.8 /100 | #143 | Good 12.6% |
| Hawaiians | 75.1 /100 | #144 | Good 12.6% |
| Immigrants | Lebanon | 75.0 /100 | #145 | Good 12.6% |
| Native Hawaiians | 75.0 /100 | #146 | Good 12.6% |
| Malaysians | 74.8 /100 | #147 | Good 12.6% |