Fijian vs Immigrants from Australia Single Male Poverty
COMPARE
Fijian
Immigrants from Australia
Single Male Poverty
Single Male Poverty Comparison
Fijians
Immigrants from Australia
13.8%
SINGLE MALE POVERTY
0.3/ 100
METRIC RATING
262nd/ 347
METRIC RANK
12.2%
SINGLE MALE POVERTY
97.1/ 100
METRIC RATING
100th/ 347
METRIC RANK
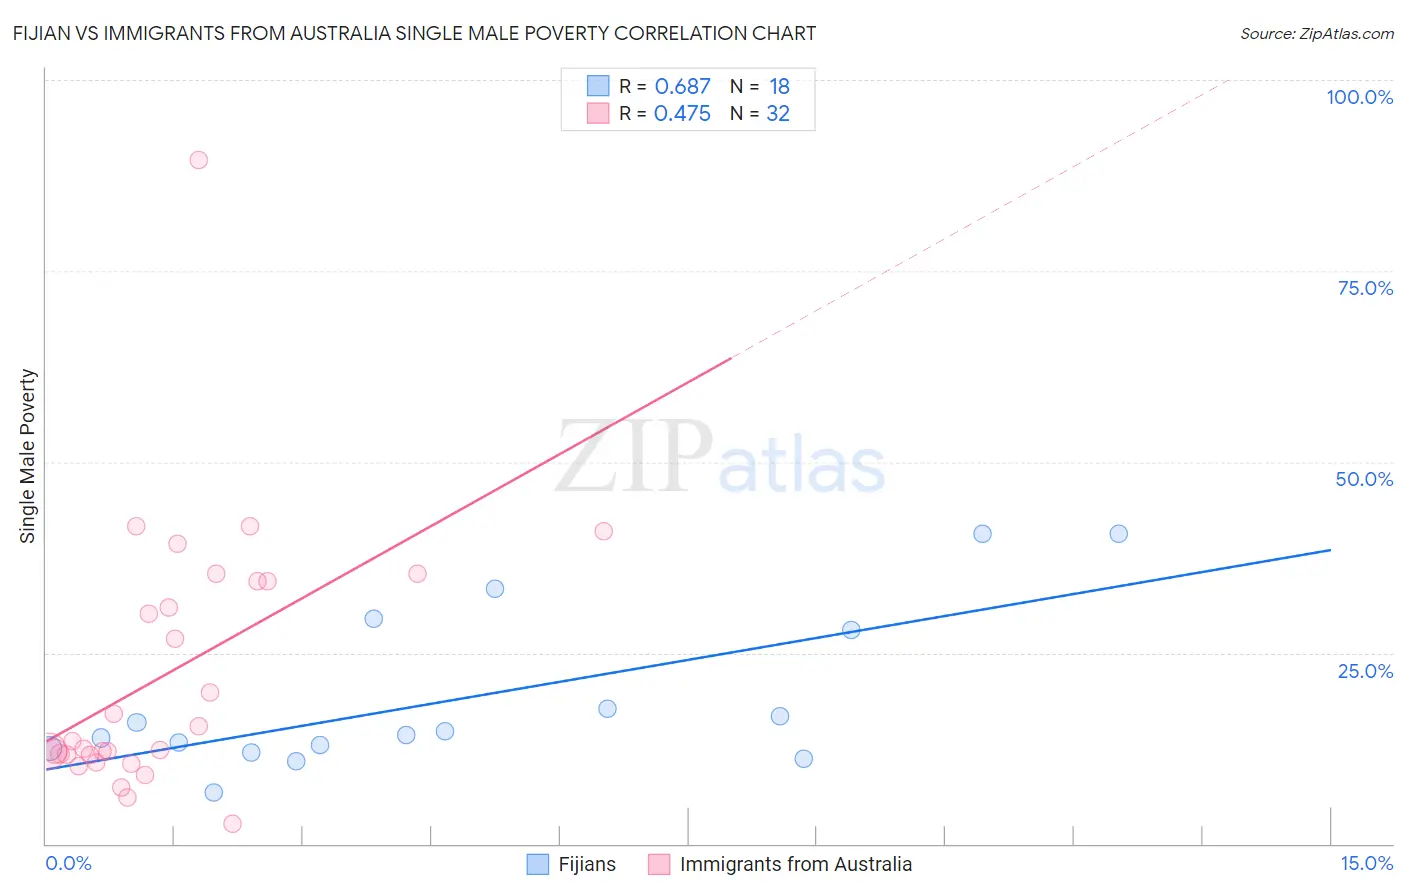
Fijian vs Immigrants from Australia Single Male Poverty Correlation Chart
The statistical analysis conducted on geographies consisting of 54,470,784 people shows a significant positive correlation between the proportion of Fijians and poverty level among single males in the United States with a correlation coefficient (R) of 0.687 and weighted average of 13.8%. Similarly, the statistical analysis conducted on geographies consisting of 206,372,420 people shows a moderate positive correlation between the proportion of Immigrants from Australia and poverty level among single males in the United States with a correlation coefficient (R) of 0.475 and weighted average of 12.2%, a difference of 13.1%.
Single Male Poverty Correlation Summary
| Measurement | Fijian | Immigrants from Australia |
| Minimum | 6.8% | 2.6% |
| Maximum | 40.5% | 89.5% |
| Range | 33.8% | 86.9% |
| Mean | 19.1% | 22.2% |
| Median | 14.5% | 12.9% |
| Interquartile 25% (IQ1) | 12.5% | 11.6% |
| Interquartile 75% (IQ3) | 28.0% | 34.4% |
| Interquartile Range (IQR) | 15.5% | 22.8% |
| Standard Deviation (Sample) | 10.4% | 17.3% |
| Standard Deviation (Population) | 10.1% | 17.0% |
Similar Demographics by Single Male Poverty
Demographics Similar to Fijians by Single Male Poverty
In terms of single male poverty, the demographic groups most similar to Fijians are Cape Verdean (13.8%, a difference of 0.12%), Hungarian (13.8%, a difference of 0.17%), Swiss (13.8%, a difference of 0.22%), Guatemalan (13.8%, a difference of 0.29%), and West Indian (13.8%, a difference of 0.31%).
| Demographics | Rating | Rank | Single Male Poverty |
| Spaniards | 0.4 /100 | #255 | Tragic 13.7% |
| Immigrants | Belize | 0.4 /100 | #256 | Tragic 13.7% |
| Immigrants | Central America | 0.3 /100 | #257 | Tragic 13.8% |
| Immigrants | Guatemala | 0.3 /100 | #258 | Tragic 13.8% |
| Guatemalans | 0.3 /100 | #259 | Tragic 13.8% |
| Swiss | 0.3 /100 | #260 | Tragic 13.8% |
| Hungarians | 0.3 /100 | #261 | Tragic 13.8% |
| Fijians | 0.3 /100 | #262 | Tragic 13.8% |
| Cape Verdeans | 0.2 /100 | #263 | Tragic 13.8% |
| West Indians | 0.2 /100 | #264 | Tragic 13.8% |
| Immigrants | Congo | 0.2 /100 | #265 | Tragic 13.9% |
| Immigrants | Cabo Verde | 0.1 /100 | #266 | Tragic 13.9% |
| Germans | 0.1 /100 | #267 | Tragic 13.9% |
| Immigrants | Mexico | 0.1 /100 | #268 | Tragic 13.9% |
| Scottish | 0.1 /100 | #269 | Tragic 14.0% |
Demographics Similar to Immigrants from Australia by Single Male Poverty
In terms of single male poverty, the demographic groups most similar to Immigrants from Australia are Immigrants from Latvia (12.2%, a difference of 0.030%), Immigrants from Europe (12.2%, a difference of 0.040%), Immigrants from Cuba (12.2%, a difference of 0.11%), Guamanian/Chamorro (12.2%, a difference of 0.15%), and Immigrants from Italy (12.2%, a difference of 0.16%).
| Demographics | Rating | Rank | Single Male Poverty |
| Immigrants | Bosnia and Herzegovina | 97.9 /100 | #93 | Exceptional 12.1% |
| Colombians | 97.8 /100 | #94 | Exceptional 12.2% |
| Mongolians | 97.7 /100 | #95 | Exceptional 12.2% |
| Immigrants | Sweden | 97.5 /100 | #96 | Exceptional 12.2% |
| Immigrants | Italy | 97.4 /100 | #97 | Exceptional 12.2% |
| Guamanians/Chamorros | 97.4 /100 | #98 | Exceptional 12.2% |
| Immigrants | Cuba | 97.3 /100 | #99 | Exceptional 12.2% |
| Immigrants | Australia | 97.1 /100 | #100 | Exceptional 12.2% |
| Immigrants | Latvia | 97.0 /100 | #101 | Exceptional 12.2% |
| Immigrants | Europe | 97.0 /100 | #102 | Exceptional 12.2% |
| Immigrants | Armenia | 96.7 /100 | #103 | Exceptional 12.2% |
| Immigrants | Kazakhstan | 96.7 /100 | #104 | Exceptional 12.2% |
| Jordanians | 95.9 /100 | #105 | Exceptional 12.3% |
| Immigrants | Morocco | 95.6 /100 | #106 | Exceptional 12.3% |
| Iraqis | 95.1 /100 | #107 | Exceptional 12.3% |