Estonian vs Mongolian Female Poverty
COMPARE
Estonian
Mongolian
Female Poverty
Female Poverty Comparison
Estonians
Mongolians
12.1%
FEMALE POVERTY
98.3/ 100
METRIC RATING
56th/ 347
METRIC RANK
13.4%
FEMALE POVERTY
53.6/ 100
METRIC RATING
172nd/ 347
METRIC RANK
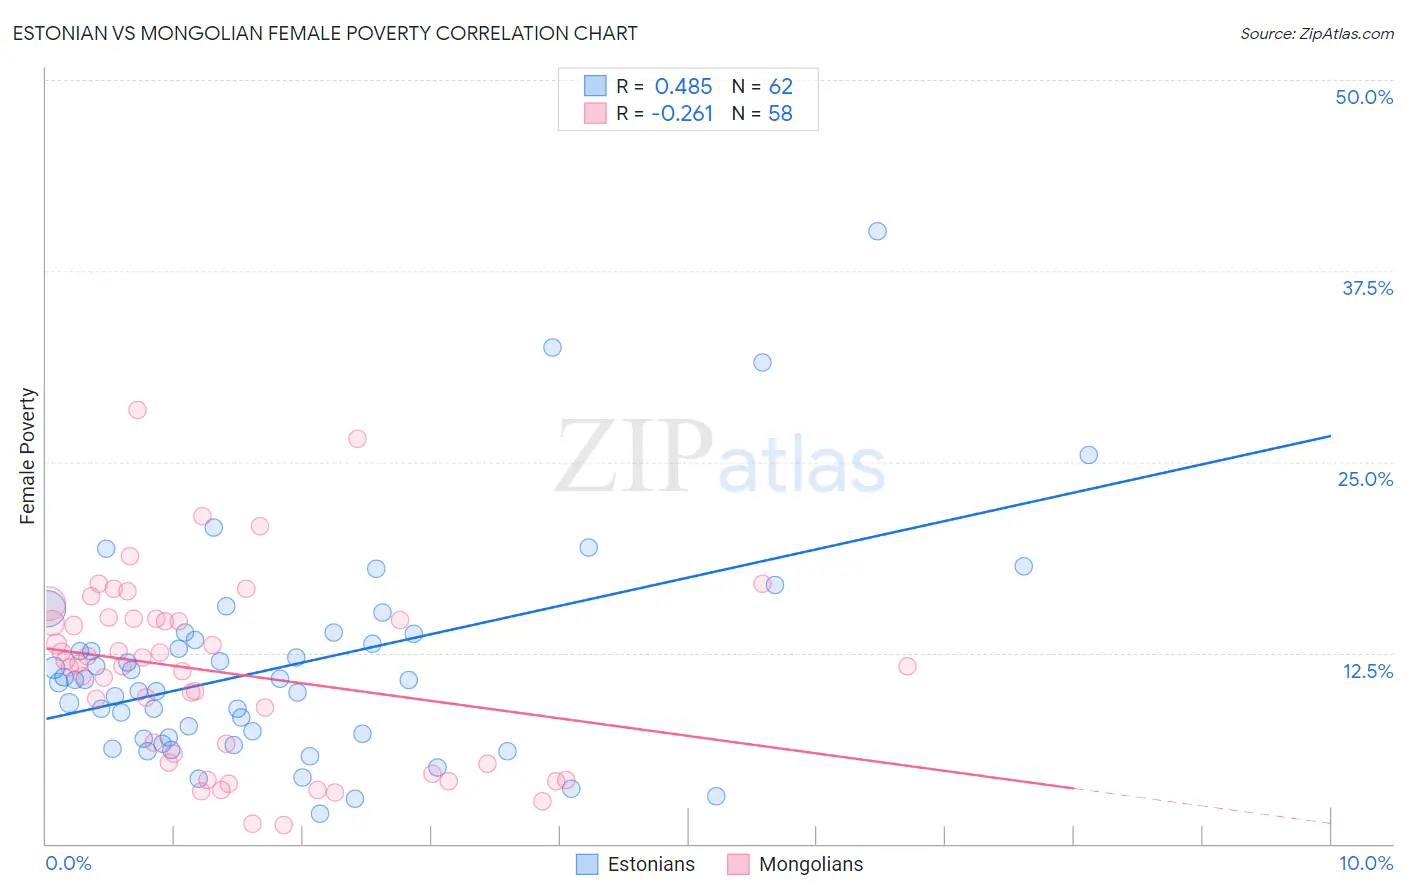
Estonian vs Mongolian Female Poverty Correlation Chart
The statistical analysis conducted on geographies consisting of 123,486,564 people shows a moderate positive correlation between the proportion of Estonians and poverty level among females in the United States with a correlation coefficient (R) of 0.485 and weighted average of 12.1%. Similarly, the statistical analysis conducted on geographies consisting of 140,282,925 people shows a weak negative correlation between the proportion of Mongolians and poverty level among females in the United States with a correlation coefficient (R) of -0.261 and weighted average of 13.4%, a difference of 10.5%.
Female Poverty Correlation Summary
| Measurement | Estonian | Mongolian |
| Minimum | 1.9% | 1.2% |
| Maximum | 40.1% | 28.4% |
| Range | 38.2% | 27.2% |
| Mean | 11.7% | 11.2% |
| Median | 10.7% | 11.7% |
| Interquartile 25% (IQ1) | 7.0% | 5.3% |
| Interquartile 75% (IQ3) | 13.8% | 14.7% |
| Interquartile Range (IQR) | 6.8% | 9.4% |
| Standard Deviation (Sample) | 7.1% | 6.0% |
| Standard Deviation (Population) | 7.0% | 5.9% |
Similar Demographics by Female Poverty
Demographics Similar to Estonians by Female Poverty
In terms of female poverty, the demographic groups most similar to Estonians are Immigrants from Serbia (12.1%, a difference of 0.060%), Scandinavian (12.1%, a difference of 0.14%), Immigrants from Europe (12.1%, a difference of 0.15%), Immigrants from Sri Lanka (12.1%, a difference of 0.25%), and Immigrants from Australia (12.2%, a difference of 0.39%).
| Demographics | Rating | Rank | Female Poverty |
| Immigrants | Romania | 99.0 /100 | #49 | Exceptional 12.0% |
| Slovenes | 98.9 /100 | #50 | Exceptional 12.0% |
| Immigrants | Bulgaria | 98.9 /100 | #51 | Exceptional 12.0% |
| Immigrants | Croatia | 98.7 /100 | #52 | Exceptional 12.0% |
| Immigrants | Austria | 98.7 /100 | #53 | Exceptional 12.0% |
| Immigrants | Philippines | 98.7 /100 | #54 | Exceptional 12.1% |
| Immigrants | Sri Lanka | 98.5 /100 | #55 | Exceptional 12.1% |
| Estonians | 98.3 /100 | #56 | Exceptional 12.1% |
| Immigrants | Serbia | 98.3 /100 | #57 | Exceptional 12.1% |
| Scandinavians | 98.2 /100 | #58 | Exceptional 12.1% |
| Immigrants | Europe | 98.2 /100 | #59 | Exceptional 12.1% |
| Immigrants | Australia | 98.1 /100 | #60 | Exceptional 12.2% |
| Immigrants | Asia | 98.1 /100 | #61 | Exceptional 12.2% |
| Immigrants | Italy | 98.0 /100 | #62 | Exceptional 12.2% |
| Ukrainians | 98.0 /100 | #63 | Exceptional 12.2% |
Demographics Similar to Mongolians by Female Poverty
In terms of female poverty, the demographic groups most similar to Mongolians are White/Caucasian (13.4%, a difference of 0.10%), Colombian (13.4%, a difference of 0.21%), Lebanese (13.4%, a difference of 0.23%), Immigrants from Afghanistan (13.4%, a difference of 0.27%), and Aleut (13.4%, a difference of 0.31%).
| Demographics | Rating | Rank | Female Poverty |
| Scotch-Irish | 62.1 /100 | #165 | Good 13.3% |
| Immigrants | Oceania | 59.7 /100 | #166 | Average 13.3% |
| Immigrants | Chile | 57.4 /100 | #167 | Average 13.3% |
| Aleuts | 56.7 /100 | #168 | Average 13.4% |
| Lebanese | 55.9 /100 | #169 | Average 13.4% |
| Colombians | 55.7 /100 | #170 | Average 13.4% |
| Whites/Caucasians | 54.6 /100 | #171 | Average 13.4% |
| Mongolians | 53.6 /100 | #172 | Average 13.4% |
| Immigrants | Afghanistan | 50.8 /100 | #173 | Average 13.4% |
| Immigrants | Iraq | 50.0 /100 | #174 | Average 13.4% |
| Celtics | 49.9 /100 | #175 | Average 13.4% |
| Immigrants | Spain | 49.9 /100 | #176 | Average 13.4% |
| Immigrants | Morocco | 49.4 /100 | #177 | Average 13.4% |
| Israelis | 49.1 /100 | #178 | Average 13.5% |
| Immigrants | Syria | 48.8 /100 | #179 | Average 13.5% |