Eastern European vs Menominee Receiving Food Stamps
COMPARE
Eastern European
Menominee
Receiving Food Stamps
Receiving Food Stamps Comparison
Eastern Europeans
Menominee
9.2%
RECEIVING FOOD STAMPS
99.8/ 100
METRIC RATING
23rd/ 347
METRIC RANK
17.2%
RECEIVING FOOD STAMPS
0.0/ 100
METRIC RATING
318th/ 347
METRIC RANK
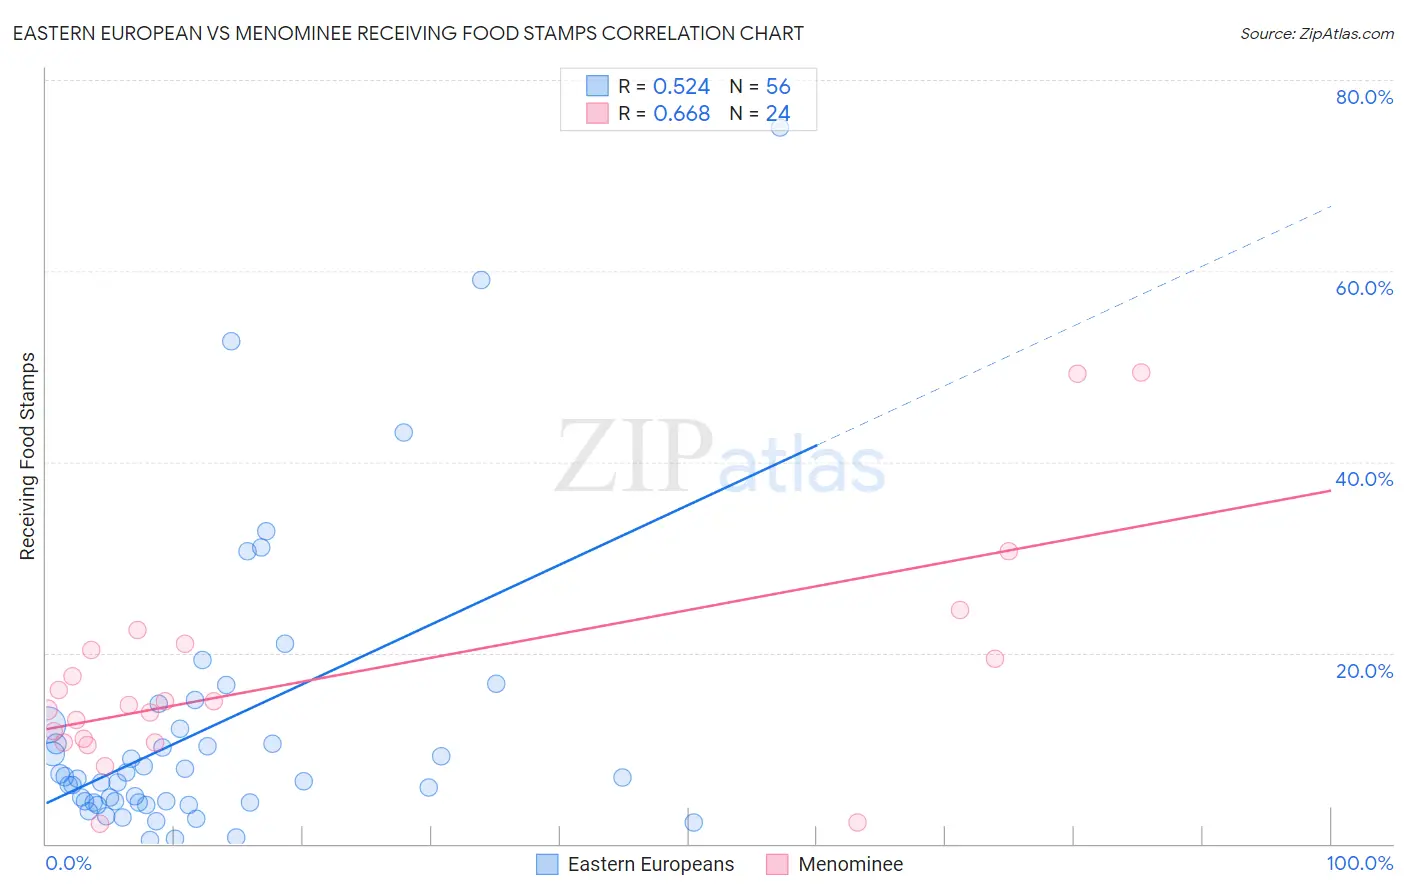
Eastern European vs Menominee Receiving Food Stamps Correlation Chart
The statistical analysis conducted on geographies consisting of 459,222,528 people shows a substantial positive correlation between the proportion of Eastern Europeans and percentage of population receiving government assistance and/or food stamps in the United States with a correlation coefficient (R) of 0.524 and weighted average of 9.2%. Similarly, the statistical analysis conducted on geographies consisting of 45,777,260 people shows a significant positive correlation between the proportion of Menominee and percentage of population receiving government assistance and/or food stamps in the United States with a correlation coefficient (R) of 0.668 and weighted average of 17.2%, a difference of 87.6%.
Receiving Food Stamps Correlation Summary
| Measurement | Eastern European | Menominee |
| Minimum | 0.35% | 2.1% |
| Maximum | 75.0% | 49.4% |
| Range | 74.7% | 47.3% |
| Mean | 12.1% | 17.6% |
| Median | 6.9% | 14.7% |
| Interquartile 25% (IQ1) | 4.3% | 10.8% |
| Interquartile 75% (IQ3) | 12.2% | 20.7% |
| Interquartile Range (IQR) | 7.9% | 9.9% |
| Standard Deviation (Sample) | 14.8% | 11.7% |
| Standard Deviation (Population) | 14.7% | 11.4% |
Similar Demographics by Receiving Food Stamps
Demographics Similar to Eastern Europeans by Receiving Food Stamps
In terms of receiving food stamps, the demographic groups most similar to Eastern Europeans are Immigrants from Northern Europe (9.2%, a difference of 0.020%), Immigrants from Australia (9.2%, a difference of 0.11%), Immigrants from Ireland (9.2%, a difference of 0.13%), Swedish (9.2%, a difference of 0.32%), and Luxembourger (9.1%, a difference of 0.36%).
| Demographics | Rating | Rank | Receiving Food Stamps |
| Immigrants | Japan | 99.9 /100 | #16 | Exceptional 9.0% |
| Immigrants | Scotland | 99.9 /100 | #17 | Exceptional 9.0% |
| Danes | 99.9 /100 | #18 | Exceptional 9.0% |
| Immigrants | Hong Kong | 99.8 /100 | #19 | Exceptional 9.1% |
| Latvians | 99.8 /100 | #20 | Exceptional 9.1% |
| Luxembourgers | 99.8 /100 | #21 | Exceptional 9.1% |
| Immigrants | Australia | 99.8 /100 | #22 | Exceptional 9.2% |
| Eastern Europeans | 99.8 /100 | #23 | Exceptional 9.2% |
| Immigrants | Northern Europe | 99.8 /100 | #24 | Exceptional 9.2% |
| Immigrants | Ireland | 99.8 /100 | #25 | Exceptional 9.2% |
| Swedes | 99.8 /100 | #26 | Exceptional 9.2% |
| Bhutanese | 99.8 /100 | #27 | Exceptional 9.2% |
| Czechs | 99.8 /100 | #28 | Exceptional 9.2% |
| Immigrants | Lithuania | 99.8 /100 | #29 | Exceptional 9.2% |
| Immigrants | Sweden | 99.7 /100 | #30 | Exceptional 9.3% |
Demographics Similar to Menominee by Receiving Food Stamps
In terms of receiving food stamps, the demographic groups most similar to Menominee are Black/African American (17.2%, a difference of 0.17%), Immigrants from St. Vincent and the Grenadines (17.2%, a difference of 0.18%), Immigrants from Nicaragua (17.2%, a difference of 0.26%), Native/Alaskan (17.3%, a difference of 0.44%), and Central American Indian (17.1%, a difference of 0.70%).
| Demographics | Rating | Rank | Receiving Food Stamps |
| Guyanese | 0.0 /100 | #311 | Tragic 16.7% |
| Sioux | 0.0 /100 | #312 | Tragic 16.8% |
| Immigrants | Jamaica | 0.0 /100 | #313 | Tragic 16.9% |
| Immigrants | Guyana | 0.0 /100 | #314 | Tragic 16.9% |
| Bahamians | 0.0 /100 | #315 | Tragic 17.0% |
| Central American Indians | 0.0 /100 | #316 | Tragic 17.1% |
| Blacks/African Americans | 0.0 /100 | #317 | Tragic 17.2% |
| Menominee | 0.0 /100 | #318 | Tragic 17.2% |
| Immigrants | St. Vincent and the Grenadines | 0.0 /100 | #319 | Tragic 17.2% |
| Immigrants | Nicaragua | 0.0 /100 | #320 | Tragic 17.2% |
| Natives/Alaskans | 0.0 /100 | #321 | Tragic 17.3% |
| Immigrants | Grenada | 0.0 /100 | #322 | Tragic 17.8% |
| Haitians | 0.0 /100 | #323 | Tragic 17.8% |
| British West Indians | 0.0 /100 | #324 | Tragic 17.9% |
| Immigrants | Haiti | 0.0 /100 | #325 | Tragic 18.2% |