Dutch West Indian vs Burmese Family Poverty
COMPARE
Dutch West Indian
Burmese
Family Poverty
Family Poverty Comparison
Dutch West Indians
Burmese
11.7%
FAMILY POVERTY
0.0/ 100
METRIC RATING
299th/ 347
METRIC RANK
7.3%
FAMILY POVERTY
99.7/ 100
METRIC RATING
25th/ 347
METRIC RANK
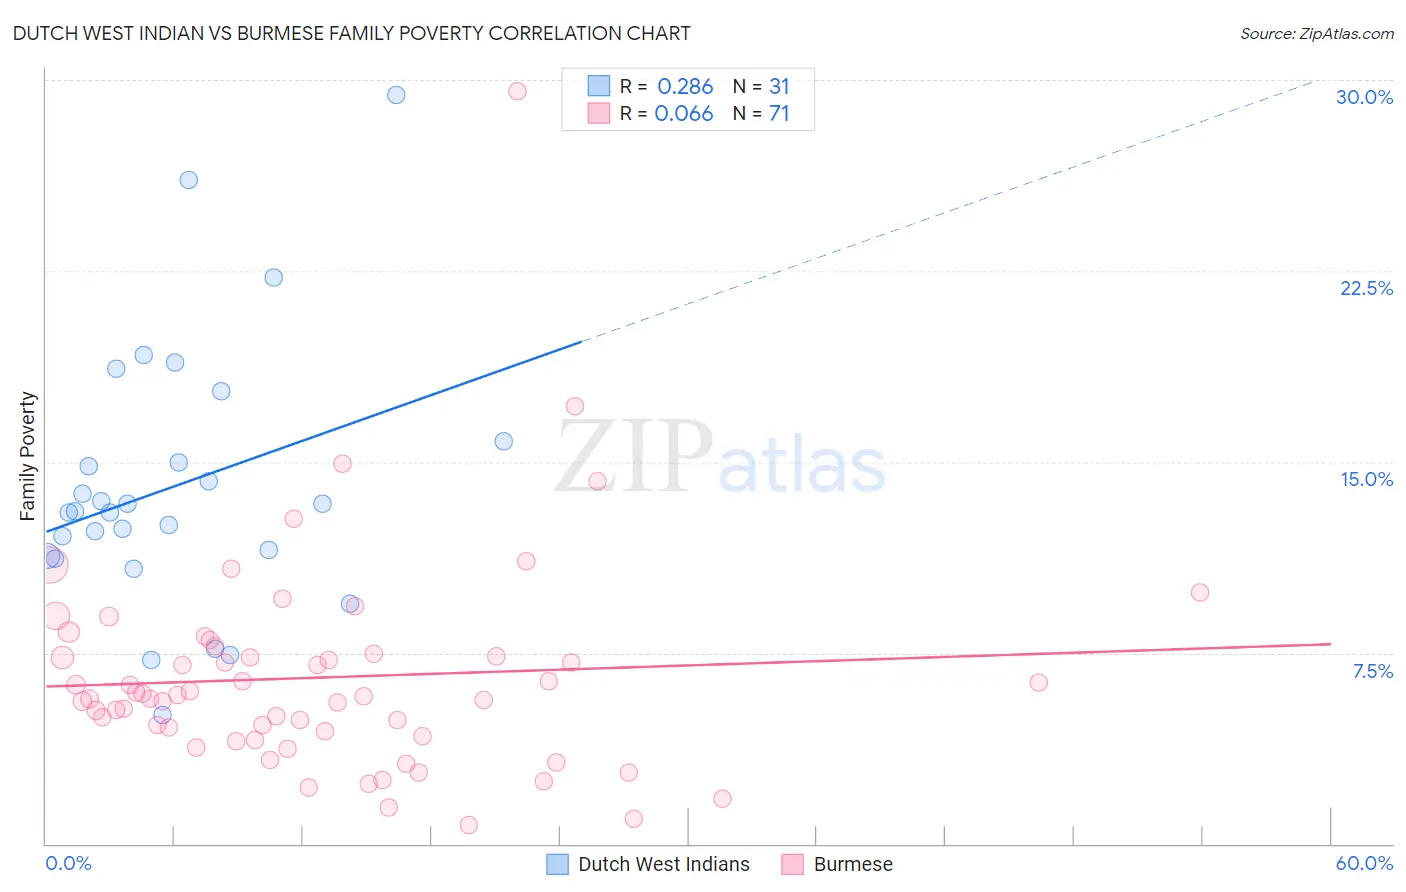
Dutch West Indian vs Burmese Family Poverty Correlation Chart
The statistical analysis conducted on geographies consisting of 85,756,421 people shows a weak positive correlation between the proportion of Dutch West Indians and poverty level among families in the United States with a correlation coefficient (R) of 0.286 and weighted average of 11.7%. Similarly, the statistical analysis conducted on geographies consisting of 463,380,335 people shows a slight positive correlation between the proportion of Burmese and poverty level among families in the United States with a correlation coefficient (R) of 0.066 and weighted average of 7.3%, a difference of 59.5%.
Family Poverty Correlation Summary
| Measurement | Dutch West Indian | Burmese |
| Minimum | 5.1% | 0.76% |
| Maximum | 29.4% | 29.5% |
| Range | 24.4% | 28.8% |
| Mean | 14.1% | 6.5% |
| Median | 13.1% | 5.8% |
| Interquartile 25% (IQ1) | 11.3% | 4.2% |
| Interquartile 75% (IQ3) | 15.8% | 7.5% |
| Interquartile Range (IQR) | 4.5% | 3.2% |
| Standard Deviation (Sample) | 5.2% | 4.2% |
| Standard Deviation (Population) | 5.1% | 4.2% |
Similar Demographics by Family Poverty
Demographics Similar to Dutch West Indians by Family Poverty
In terms of family poverty, the demographic groups most similar to Dutch West Indians are Immigrants from Bangladesh (11.7%, a difference of 0.010%), Immigrants from Senegal (11.7%, a difference of 0.10%), Creek (11.7%, a difference of 0.24%), Bahamian (11.7%, a difference of 0.27%), and Guatemalan (11.7%, a difference of 0.31%).
| Demographics | Rating | Rank | Family Poverty |
| Immigrants | Somalia | 0.0 /100 | #292 | Tragic 11.5% |
| Immigrants | Cabo Verde | 0.0 /100 | #293 | Tragic 11.6% |
| Immigrants | St. Vincent and the Grenadines | 0.0 /100 | #294 | Tragic 11.6% |
| Immigrants | Haiti | 0.0 /100 | #295 | Tragic 11.6% |
| Choctaw | 0.0 /100 | #296 | Tragic 11.6% |
| Creek | 0.0 /100 | #297 | Tragic 11.7% |
| Immigrants | Senegal | 0.0 /100 | #298 | Tragic 11.7% |
| Dutch West Indians | 0.0 /100 | #299 | Tragic 11.7% |
| Immigrants | Bangladesh | 0.0 /100 | #300 | Tragic 11.7% |
| Bahamians | 0.0 /100 | #301 | Tragic 11.7% |
| Guatemalans | 0.0 /100 | #302 | Tragic 11.7% |
| Africans | 0.0 /100 | #303 | Tragic 11.8% |
| Immigrants | Latin America | 0.0 /100 | #304 | Tragic 11.8% |
| Mexicans | 0.0 /100 | #305 | Tragic 11.8% |
| Cajuns | 0.0 /100 | #306 | Tragic 11.9% |
Demographics Similar to Burmese by Family Poverty
In terms of family poverty, the demographic groups most similar to Burmese are Croatian (7.3%, a difference of 0.0%), Cypriot (7.3%, a difference of 0.24%), Immigrants from Scotland (7.3%, a difference of 0.26%), Assyrian/Chaldean/Syriac (7.3%, a difference of 0.30%), and Danish (7.3%, a difference of 0.32%).
| Demographics | Rating | Rank | Family Poverty |
| Immigrants | Lithuania | 99.8 /100 | #18 | Exceptional 7.2% |
| Eastern Europeans | 99.7 /100 | #19 | Exceptional 7.2% |
| Immigrants | Hong Kong | 99.7 /100 | #20 | Exceptional 7.3% |
| Immigrants | Iran | 99.7 /100 | #21 | Exceptional 7.3% |
| Danes | 99.7 /100 | #22 | Exceptional 7.3% |
| Assyrians/Chaldeans/Syriacs | 99.7 /100 | #23 | Exceptional 7.3% |
| Croatians | 99.7 /100 | #24 | Exceptional 7.3% |
| Burmese | 99.7 /100 | #25 | Exceptional 7.3% |
| Cypriots | 99.6 /100 | #26 | Exceptional 7.3% |
| Immigrants | Scotland | 99.6 /100 | #27 | Exceptional 7.3% |
| Immigrants | Korea | 99.6 /100 | #28 | Exceptional 7.4% |
| Immigrants | Northern Europe | 99.6 /100 | #29 | Exceptional 7.4% |
| Italians | 99.6 /100 | #30 | Exceptional 7.4% |
| Czechs | 99.6 /100 | #31 | Exceptional 7.4% |
| Poles | 99.5 /100 | #32 | Exceptional 7.4% |