Dutch West Indian vs Taiwanese Family Poverty
COMPARE
Dutch West Indian
Taiwanese
Family Poverty
Family Poverty Comparison
Dutch West Indians
Taiwanese
11.7%
FAMILY POVERTY
0.0/ 100
METRIC RATING
299th/ 347
METRIC RANK
8.2%
FAMILY POVERTY
94.6/ 100
METRIC RATING
111th/ 347
METRIC RANK
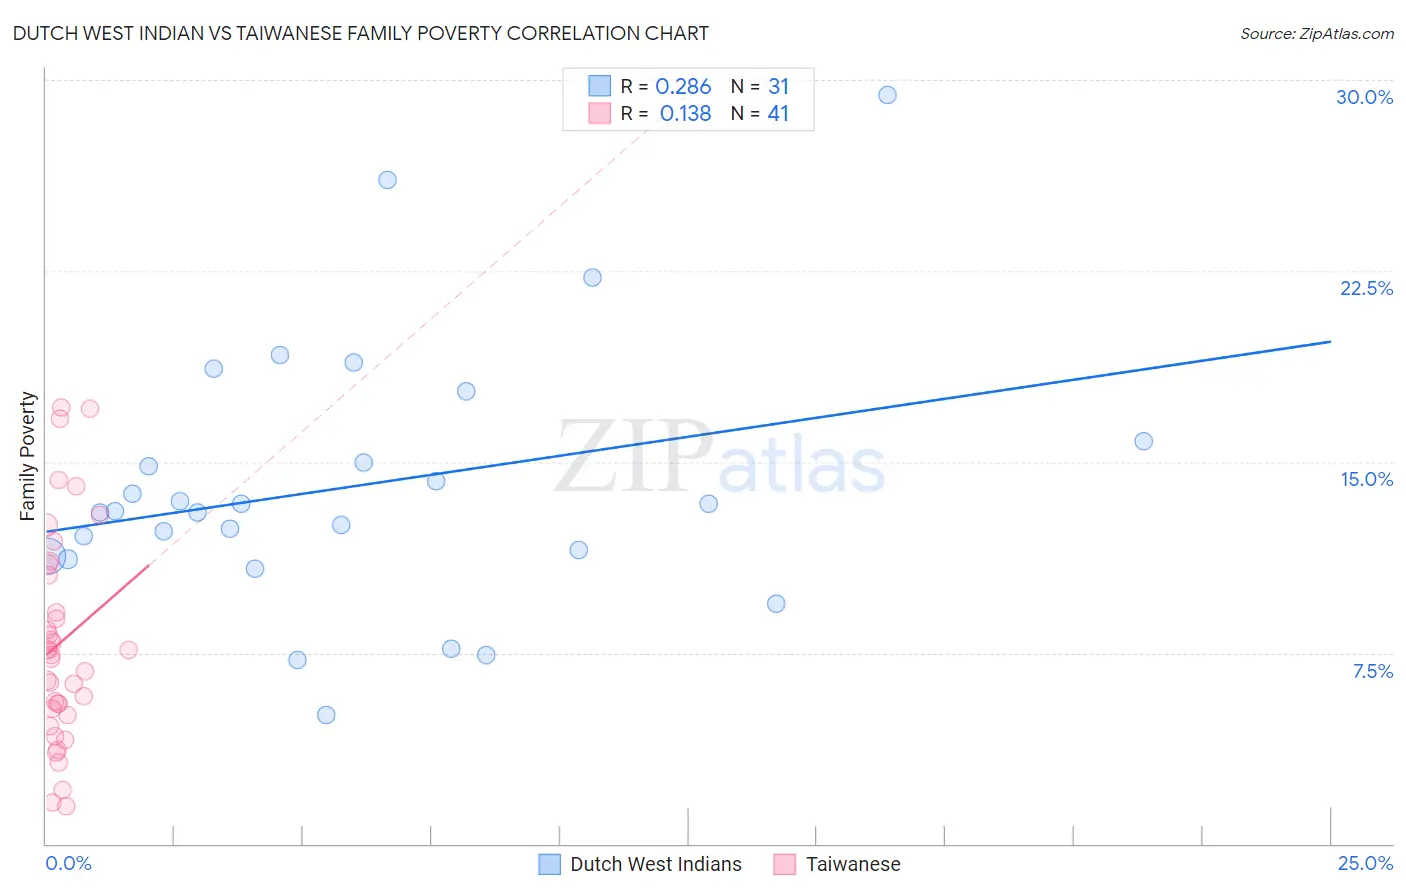
Dutch West Indian vs Taiwanese Family Poverty Correlation Chart
The statistical analysis conducted on geographies consisting of 85,756,421 people shows a weak positive correlation between the proportion of Dutch West Indians and poverty level among families in the United States with a correlation coefficient (R) of 0.286 and weighted average of 11.7%. Similarly, the statistical analysis conducted on geographies consisting of 31,669,641 people shows a poor positive correlation between the proportion of Taiwanese and poverty level among families in the United States with a correlation coefficient (R) of 0.138 and weighted average of 8.2%, a difference of 43.1%.
Family Poverty Correlation Summary
| Measurement | Dutch West Indian | Taiwanese |
| Minimum | 5.1% | 1.5% |
| Maximum | 29.4% | 17.2% |
| Range | 24.4% | 15.7% |
| Mean | 14.1% | 7.9% |
| Median | 13.1% | 7.4% |
| Interquartile 25% (IQ1) | 11.3% | 5.2% |
| Interquartile 75% (IQ3) | 15.8% | 10.8% |
| Interquartile Range (IQR) | 4.5% | 5.6% |
| Standard Deviation (Sample) | 5.2% | 4.1% |
| Standard Deviation (Population) | 5.1% | 4.1% |
Similar Demographics by Family Poverty
Demographics Similar to Dutch West Indians by Family Poverty
In terms of family poverty, the demographic groups most similar to Dutch West Indians are Immigrants from Bangladesh (11.7%, a difference of 0.010%), Immigrants from Senegal (11.7%, a difference of 0.10%), Creek (11.7%, a difference of 0.24%), Bahamian (11.7%, a difference of 0.27%), and Guatemalan (11.7%, a difference of 0.31%).
| Demographics | Rating | Rank | Family Poverty |
| Immigrants | Somalia | 0.0 /100 | #292 | Tragic 11.5% |
| Immigrants | Cabo Verde | 0.0 /100 | #293 | Tragic 11.6% |
| Immigrants | St. Vincent and the Grenadines | 0.0 /100 | #294 | Tragic 11.6% |
| Immigrants | Haiti | 0.0 /100 | #295 | Tragic 11.6% |
| Choctaw | 0.0 /100 | #296 | Tragic 11.6% |
| Creek | 0.0 /100 | #297 | Tragic 11.7% |
| Immigrants | Senegal | 0.0 /100 | #298 | Tragic 11.7% |
| Dutch West Indians | 0.0 /100 | #299 | Tragic 11.7% |
| Immigrants | Bangladesh | 0.0 /100 | #300 | Tragic 11.7% |
| Bahamians | 0.0 /100 | #301 | Tragic 11.7% |
| Guatemalans | 0.0 /100 | #302 | Tragic 11.7% |
| Africans | 0.0 /100 | #303 | Tragic 11.8% |
| Immigrants | Latin America | 0.0 /100 | #304 | Tragic 11.8% |
| Mexicans | 0.0 /100 | #305 | Tragic 11.8% |
| Cajuns | 0.0 /100 | #306 | Tragic 11.9% |
Demographics Similar to Taiwanese by Family Poverty
In terms of family poverty, the demographic groups most similar to Taiwanese are Romanian (8.2%, a difference of 0.060%), Immigrants from France (8.2%, a difference of 0.11%), Jordanian (8.2%, a difference of 0.15%), Basque (8.1%, a difference of 0.23%), and Canadian (8.2%, a difference of 0.28%).
| Demographics | Rating | Rank | Family Poverty |
| Slavs | 95.6 /100 | #104 | Exceptional 8.1% |
| Laotians | 95.6 /100 | #105 | Exceptional 8.1% |
| Egyptians | 95.1 /100 | #106 | Exceptional 8.1% |
| French Canadians | 95.0 /100 | #107 | Exceptional 8.1% |
| Basques | 94.9 /100 | #108 | Exceptional 8.1% |
| Jordanians | 94.8 /100 | #109 | Exceptional 8.2% |
| Romanians | 94.7 /100 | #110 | Exceptional 8.2% |
| Taiwanese | 94.6 /100 | #111 | Exceptional 8.2% |
| Immigrants | France | 94.4 /100 | #112 | Exceptional 8.2% |
| Canadians | 94.2 /100 | #113 | Exceptional 8.2% |
| Immigrants | Zimbabwe | 94.0 /100 | #114 | Exceptional 8.2% |
| Immigrants | Israel | 93.5 /100 | #115 | Exceptional 8.2% |
| South Africans | 93.4 /100 | #116 | Exceptional 8.2% |
| Immigrants | Russia | 93.2 /100 | #117 | Exceptional 8.2% |
| Immigrants | Western Europe | 92.9 /100 | #118 | Exceptional 8.2% |