Dutch vs Vietnamese Receiving Food Stamps
COMPARE
Dutch
Vietnamese
Receiving Food Stamps
Receiving Food Stamps Comparison
Dutch
Vietnamese
10.0%
RECEIVING FOOD STAMPS
98.6/ 100
METRIC RATING
83rd/ 347
METRIC RANK
15.7%
RECEIVING FOOD STAMPS
0.0/ 100
METRIC RATING
293rd/ 347
METRIC RANK
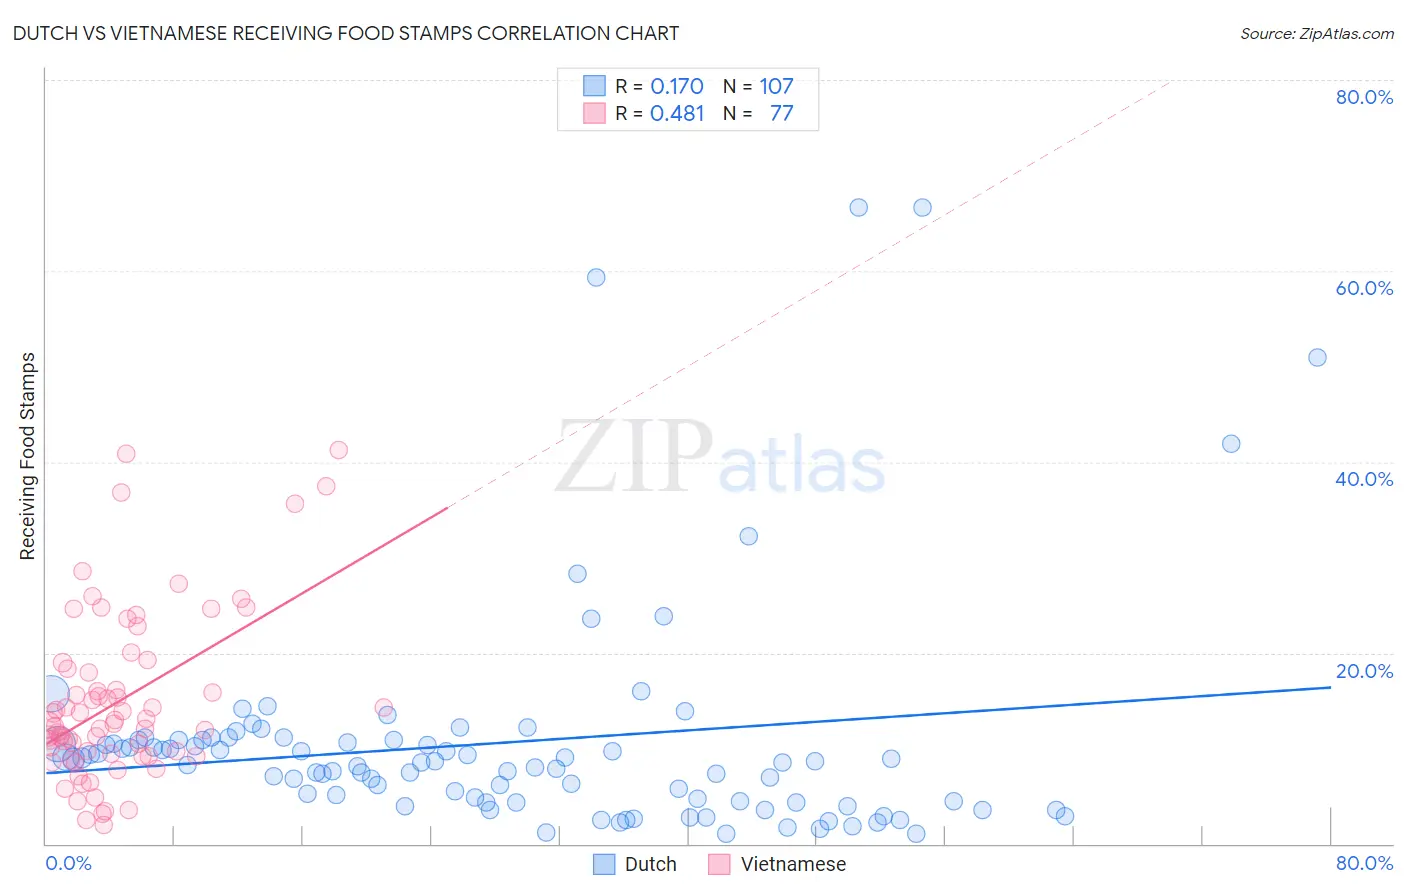
Dutch vs Vietnamese Receiving Food Stamps Correlation Chart
The statistical analysis conducted on geographies consisting of 551,299,483 people shows a poor positive correlation between the proportion of Dutch and percentage of population receiving government assistance and/or food stamps in the United States with a correlation coefficient (R) of 0.170 and weighted average of 10.0%. Similarly, the statistical analysis conducted on geographies consisting of 170,448,665 people shows a moderate positive correlation between the proportion of Vietnamese and percentage of population receiving government assistance and/or food stamps in the United States with a correlation coefficient (R) of 0.481 and weighted average of 15.7%, a difference of 56.6%.
Receiving Food Stamps Correlation Summary
| Measurement | Dutch | Vietnamese |
| Minimum | 0.99% | 1.9% |
| Maximum | 66.7% | 41.3% |
| Range | 65.7% | 39.4% |
| Mean | 10.6% | 15.0% |
| Median | 8.5% | 12.6% |
| Interquartile 25% (IQ1) | 4.5% | 9.2% |
| Interquartile 75% (IQ3) | 10.8% | 18.6% |
| Interquartile Range (IQR) | 6.3% | 9.4% |
| Standard Deviation (Sample) | 11.8% | 8.8% |
| Standard Deviation (Population) | 11.7% | 8.8% |
Similar Demographics by Receiving Food Stamps
Demographics Similar to Dutch by Receiving Food Stamps
In terms of receiving food stamps, the demographic groups most similar to Dutch are Austrian (10.0%, a difference of 0.0%), Immigrants from Israel (10.0%, a difference of 0.070%), Immigrants from England (10.0%, a difference of 0.13%), Immigrants from Romania (10.0%, a difference of 0.25%), and Polish (10.0%, a difference of 0.27%).
| Demographics | Rating | Rank | Receiving Food Stamps |
| Immigrants | Croatia | 98.7 /100 | #76 | Exceptional 10.0% |
| Immigrants | North Macedonia | 98.7 /100 | #77 | Exceptional 10.0% |
| South Africans | 98.7 /100 | #78 | Exceptional 10.0% |
| Laotians | 98.7 /100 | #79 | Exceptional 10.0% |
| Poles | 98.6 /100 | #80 | Exceptional 10.0% |
| Immigrants | England | 98.6 /100 | #81 | Exceptional 10.0% |
| Austrians | 98.6 /100 | #82 | Exceptional 10.0% |
| Dutch | 98.6 /100 | #83 | Exceptional 10.0% |
| Immigrants | Israel | 98.5 /100 | #84 | Exceptional 10.0% |
| Immigrants | Romania | 98.5 /100 | #85 | Exceptional 10.0% |
| Immigrants | Norway | 98.4 /100 | #86 | Exceptional 10.0% |
| Egyptians | 98.4 /100 | #87 | Exceptional 10.0% |
| Immigrants | Kuwait | 98.4 /100 | #88 | Exceptional 10.0% |
| Immigrants | France | 98.3 /100 | #89 | Exceptional 10.1% |
| Finns | 97.9 /100 | #90 | Exceptional 10.2% |
Demographics Similar to Vietnamese by Receiving Food Stamps
In terms of receiving food stamps, the demographic groups most similar to Vietnamese are Immigrants from Latin America (15.7%, a difference of 0.11%), Alaska Native (15.6%, a difference of 0.30%), Immigrants from Honduras (15.7%, a difference of 0.43%), Tsimshian (15.7%, a difference of 0.44%), and Immigrants from Bahamas (15.8%, a difference of 0.60%).
| Demographics | Rating | Rank | Receiving Food Stamps |
| Africans | 0.0 /100 | #286 | Tragic 15.1% |
| Immigrants | Mexico | 0.0 /100 | #287 | Tragic 15.2% |
| Immigrants | Belize | 0.0 /100 | #288 | Tragic 15.2% |
| Immigrants | Senegal | 0.0 /100 | #289 | Tragic 15.3% |
| Senegalese | 0.0 /100 | #290 | Tragic 15.4% |
| Hondurans | 0.0 /100 | #291 | Tragic 15.5% |
| Alaska Natives | 0.0 /100 | #292 | Tragic 15.6% |
| Vietnamese | 0.0 /100 | #293 | Tragic 15.7% |
| Immigrants | Latin America | 0.0 /100 | #294 | Tragic 15.7% |
| Immigrants | Honduras | 0.0 /100 | #295 | Tragic 15.7% |
| Tsimshian | 0.0 /100 | #296 | Tragic 15.7% |
| Immigrants | Bahamas | 0.0 /100 | #297 | Tragic 15.8% |
| Immigrants | Trinidad and Tobago | 0.0 /100 | #298 | Tragic 15.8% |
| Hispanics or Latinos | 0.0 /100 | #299 | Tragic 15.8% |
| Immigrants | Bangladesh | 0.0 /100 | #300 | Tragic 15.9% |