Dutch vs English Receiving Food Stamps
COMPARE
Dutch
English
Receiving Food Stamps
Receiving Food Stamps Comparison
Dutch
English
10.0%
RECEIVING FOOD STAMPS
98.6/ 100
METRIC RATING
83rd/ 347
METRIC RANK
9.8%
RECEIVING FOOD STAMPS
99.2/ 100
METRIC RATING
61st/ 347
METRIC RANK
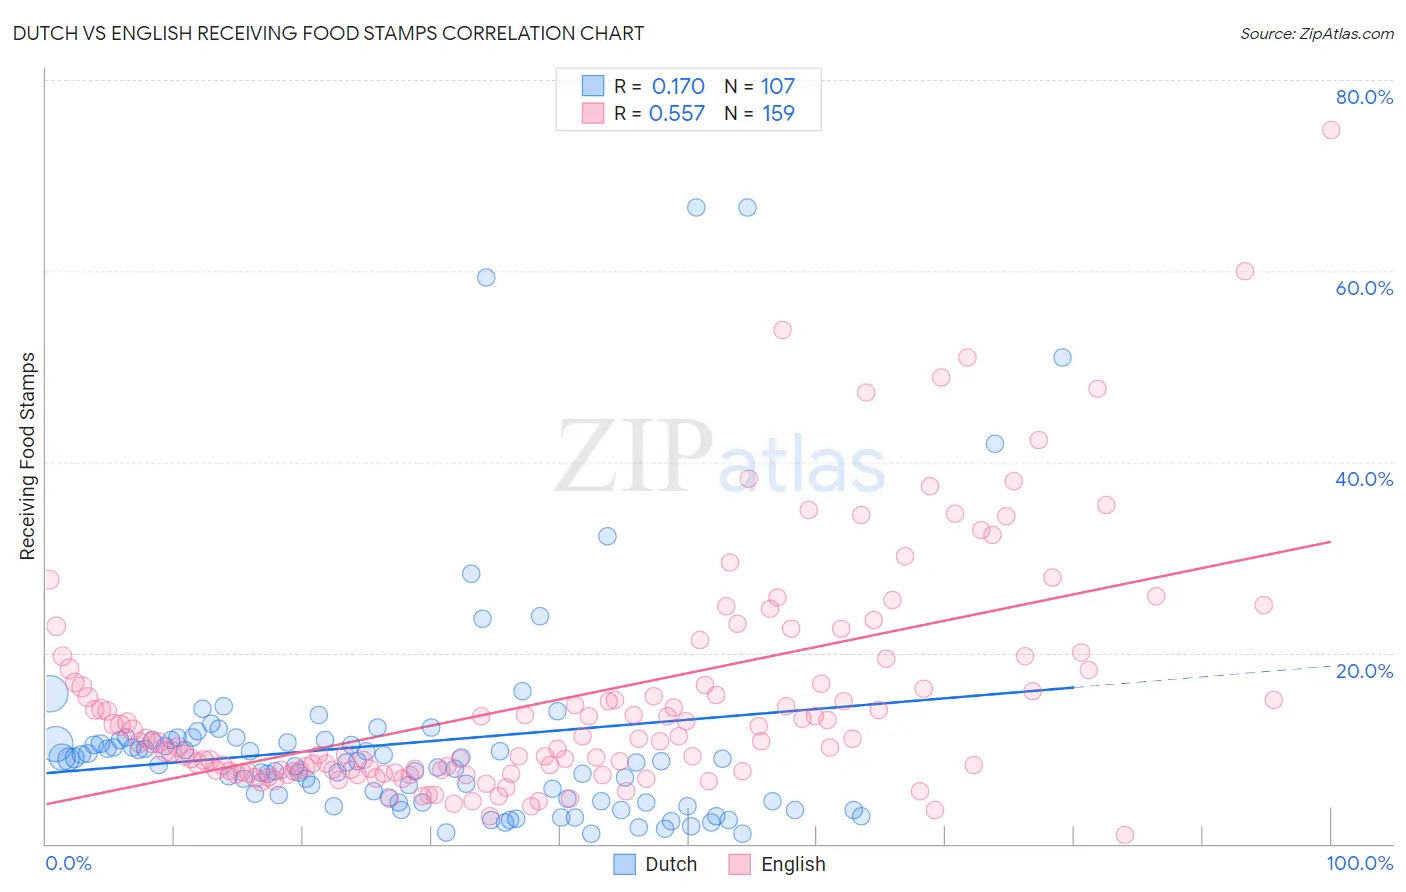
Dutch vs English Receiving Food Stamps Correlation Chart
The statistical analysis conducted on geographies consisting of 551,299,483 people shows a poor positive correlation between the proportion of Dutch and percentage of population receiving government assistance and/or food stamps in the United States with a correlation coefficient (R) of 0.170 and weighted average of 10.0%. Similarly, the statistical analysis conducted on geographies consisting of 575,562,331 people shows a substantial positive correlation between the proportion of English and percentage of population receiving government assistance and/or food stamps in the United States with a correlation coefficient (R) of 0.557 and weighted average of 9.8%, a difference of 2.5%.
Receiving Food Stamps Correlation Summary
| Measurement | Dutch | English |
| Minimum | 0.99% | 0.90% |
| Maximum | 66.7% | 74.8% |
| Range | 65.7% | 73.9% |
| Mean | 10.6% | 15.3% |
| Median | 8.5% | 10.8% |
| Interquartile 25% (IQ1) | 4.5% | 7.6% |
| Interquartile 75% (IQ3) | 10.8% | 18.2% |
| Interquartile Range (IQR) | 6.3% | 10.6% |
| Standard Deviation (Sample) | 11.8% | 12.2% |
| Standard Deviation (Population) | 11.7% | 12.1% |
Similar Demographics by Receiving Food Stamps
Demographics Similar to Dutch by Receiving Food Stamps
In terms of receiving food stamps, the demographic groups most similar to Dutch are Austrian (10.0%, a difference of 0.0%), Immigrants from Israel (10.0%, a difference of 0.070%), Immigrants from England (10.0%, a difference of 0.13%), Immigrants from Romania (10.0%, a difference of 0.25%), and Polish (10.0%, a difference of 0.27%).
| Demographics | Rating | Rank | Receiving Food Stamps |
| Immigrants | Croatia | 98.7 /100 | #76 | Exceptional 10.0% |
| Immigrants | North Macedonia | 98.7 /100 | #77 | Exceptional 10.0% |
| South Africans | 98.7 /100 | #78 | Exceptional 10.0% |
| Laotians | 98.7 /100 | #79 | Exceptional 10.0% |
| Poles | 98.6 /100 | #80 | Exceptional 10.0% |
| Immigrants | England | 98.6 /100 | #81 | Exceptional 10.0% |
| Austrians | 98.6 /100 | #82 | Exceptional 10.0% |
| Dutch | 98.6 /100 | #83 | Exceptional 10.0% |
| Immigrants | Israel | 98.5 /100 | #84 | Exceptional 10.0% |
| Immigrants | Romania | 98.5 /100 | #85 | Exceptional 10.0% |
| Immigrants | Norway | 98.4 /100 | #86 | Exceptional 10.0% |
| Egyptians | 98.4 /100 | #87 | Exceptional 10.0% |
| Immigrants | Kuwait | 98.4 /100 | #88 | Exceptional 10.0% |
| Immigrants | France | 98.3 /100 | #89 | Exceptional 10.1% |
| Finns | 97.9 /100 | #90 | Exceptional 10.2% |
Demographics Similar to English by Receiving Food Stamps
In terms of receiving food stamps, the demographic groups most similar to English are Immigrants from Bulgaria (9.8%, a difference of 0.080%), Chinese (9.8%, a difference of 0.11%), German (9.7%, a difference of 0.14%), Immigrants from North America (9.8%, a difference of 0.19%), and British (9.7%, a difference of 0.24%).
| Demographics | Rating | Rank | Receiving Food Stamps |
| Swiss | 99.3 /100 | #54 | Exceptional 9.7% |
| Immigrants | Switzerland | 99.3 /100 | #55 | Exceptional 9.7% |
| Immigrants | Canada | 99.3 /100 | #56 | Exceptional 9.7% |
| Greeks | 99.3 /100 | #57 | Exceptional 9.7% |
| Scandinavians | 99.2 /100 | #58 | Exceptional 9.7% |
| British | 99.2 /100 | #59 | Exceptional 9.7% |
| Germans | 99.2 /100 | #60 | Exceptional 9.7% |
| English | 99.2 /100 | #61 | Exceptional 9.8% |
| Immigrants | Bulgaria | 99.2 /100 | #62 | Exceptional 9.8% |
| Chinese | 99.2 /100 | #63 | Exceptional 9.8% |
| Immigrants | North America | 99.2 /100 | #64 | Exceptional 9.8% |
| Immigrants | Turkey | 99.1 /100 | #65 | Exceptional 9.8% |
| Slovenes | 99.1 /100 | #66 | Exceptional 9.8% |
| Immigrants | Indonesia | 99.0 /100 | #67 | Exceptional 9.8% |
| Northern Europeans | 99.0 /100 | #68 | Exceptional 9.8% |