Immigrants from the Azores vs Immigrants from Central America Receiving Food Stamps
COMPARE
Immigrants from the Azores
Immigrants from Central America
Receiving Food Stamps
Receiving Food Stamps Comparison
Immigrants from the Azores
Immigrants from Central America
16.4%
RECEIVING FOOD STAMPS
0.0/ 100
METRIC RATING
305th/ 347
METRIC RANK
15.0%
RECEIVING FOOD STAMPS
0.0/ 100
METRIC RATING
282nd/ 347
METRIC RANK
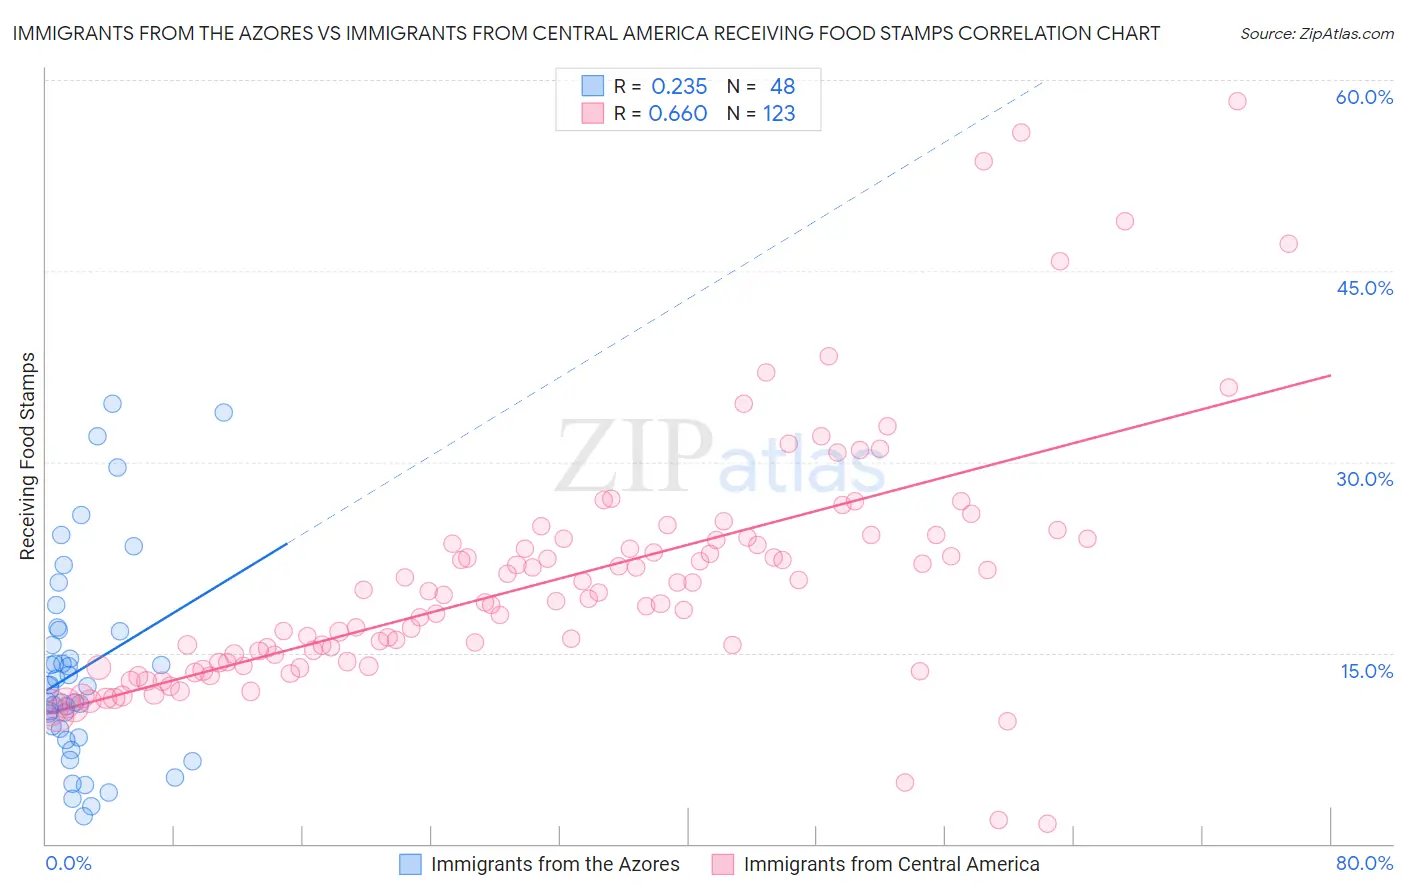
Immigrants from the Azores vs Immigrants from Central America Receiving Food Stamps Correlation Chart
The statistical analysis conducted on geographies consisting of 46,243,454 people shows a weak positive correlation between the proportion of Immigrants from the Azores and percentage of population receiving government assistance and/or food stamps in the United States with a correlation coefficient (R) of 0.235 and weighted average of 16.4%. Similarly, the statistical analysis conducted on geographies consisting of 534,248,687 people shows a significant positive correlation between the proportion of Immigrants from Central America and percentage of population receiving government assistance and/or food stamps in the United States with a correlation coefficient (R) of 0.660 and weighted average of 15.0%, a difference of 9.3%.
Receiving Food Stamps Correlation Summary
| Measurement | Immigrants from the Azores | Immigrants from Central America |
| Minimum | 2.2% | 1.6% |
| Maximum | 34.6% | 58.3% |
| Range | 32.4% | 56.7% |
| Mean | 13.7% | 20.7% |
| Median | 12.3% | 19.3% |
| Interquartile 25% (IQ1) | 8.7% | 14.2% |
| Interquartile 75% (IQ3) | 16.7% | 24.0% |
| Interquartile Range (IQR) | 8.1% | 9.7% |
| Standard Deviation (Sample) | 7.9% | 9.7% |
| Standard Deviation (Population) | 7.9% | 9.7% |
Similar Demographics by Receiving Food Stamps
Demographics Similar to Immigrants from the Azores by Receiving Food Stamps
In terms of receiving food stamps, the demographic groups most similar to Immigrants from the Azores are Jamaican (16.4%, a difference of 0.070%), Houma (16.5%, a difference of 0.35%), Barbadian (16.5%, a difference of 0.62%), U.S. Virgin Islander (16.5%, a difference of 0.86%), and West Indian (16.3%, a difference of 0.88%).
| Demographics | Rating | Rank | Receiving Food Stamps |
| Immigrants | Trinidad and Tobago | 0.0 /100 | #298 | Tragic 15.8% |
| Hispanics or Latinos | 0.0 /100 | #299 | Tragic 15.8% |
| Immigrants | Bangladesh | 0.0 /100 | #300 | Tragic 15.9% |
| Trinidadians and Tobagonians | 0.0 /100 | #301 | Tragic 16.0% |
| Immigrants | West Indies | 0.0 /100 | #302 | Tragic 16.1% |
| Nicaraguans | 0.0 /100 | #303 | Tragic 16.1% |
| West Indians | 0.0 /100 | #304 | Tragic 16.3% |
| Immigrants | Azores | 0.0 /100 | #305 | Tragic 16.4% |
| Jamaicans | 0.0 /100 | #306 | Tragic 16.4% |
| Houma | 0.0 /100 | #307 | Tragic 16.5% |
| Barbadians | 0.0 /100 | #308 | Tragic 16.5% |
| U.S. Virgin Islanders | 0.0 /100 | #309 | Tragic 16.5% |
| Immigrants | Barbados | 0.0 /100 | #310 | Tragic 16.6% |
| Guyanese | 0.0 /100 | #311 | Tragic 16.7% |
| Sioux | 0.0 /100 | #312 | Tragic 16.8% |
Demographics Similar to Immigrants from Central America by Receiving Food Stamps
In terms of receiving food stamps, the demographic groups most similar to Immigrants from Central America are Bangladeshi (15.0%, a difference of 0.28%), Immigrants from Ecuador (15.0%, a difference of 0.29%), Spanish American Indian (14.9%, a difference of 0.52%), Immigrants from Liberia (15.1%, a difference of 0.67%), and African (15.1%, a difference of 0.81%).
| Demographics | Rating | Rank | Receiving Food Stamps |
| Ute | 0.1 /100 | #275 | Tragic 14.7% |
| Liberians | 0.1 /100 | #276 | Tragic 14.8% |
| Seminole | 0.1 /100 | #277 | Tragic 14.8% |
| Belizeans | 0.1 /100 | #278 | Tragic 14.8% |
| Kiowa | 0.0 /100 | #279 | Tragic 14.9% |
| Ecuadorians | 0.0 /100 | #280 | Tragic 14.9% |
| Spanish American Indians | 0.0 /100 | #281 | Tragic 14.9% |
| Immigrants | Central America | 0.0 /100 | #282 | Tragic 15.0% |
| Bangladeshis | 0.0 /100 | #283 | Tragic 15.0% |
| Immigrants | Ecuador | 0.0 /100 | #284 | Tragic 15.0% |
| Immigrants | Liberia | 0.0 /100 | #285 | Tragic 15.1% |
| Africans | 0.0 /100 | #286 | Tragic 15.1% |
| Immigrants | Mexico | 0.0 /100 | #287 | Tragic 15.2% |
| Immigrants | Belize | 0.0 /100 | #288 | Tragic 15.2% |
| Immigrants | Senegal | 0.0 /100 | #289 | Tragic 15.3% |