Crow vs Sudanese Single Male Poverty
COMPARE
Crow
Sudanese
Single Male Poverty
Single Male Poverty Comparison
Crow
Sudanese
23.3%
SINGLE MALE POVERTY
0.0/ 100
METRIC RATING
341st/ 347
METRIC RANK
13.1%
SINGLE MALE POVERTY
17.7/ 100
METRIC RATING
207th/ 347
METRIC RANK
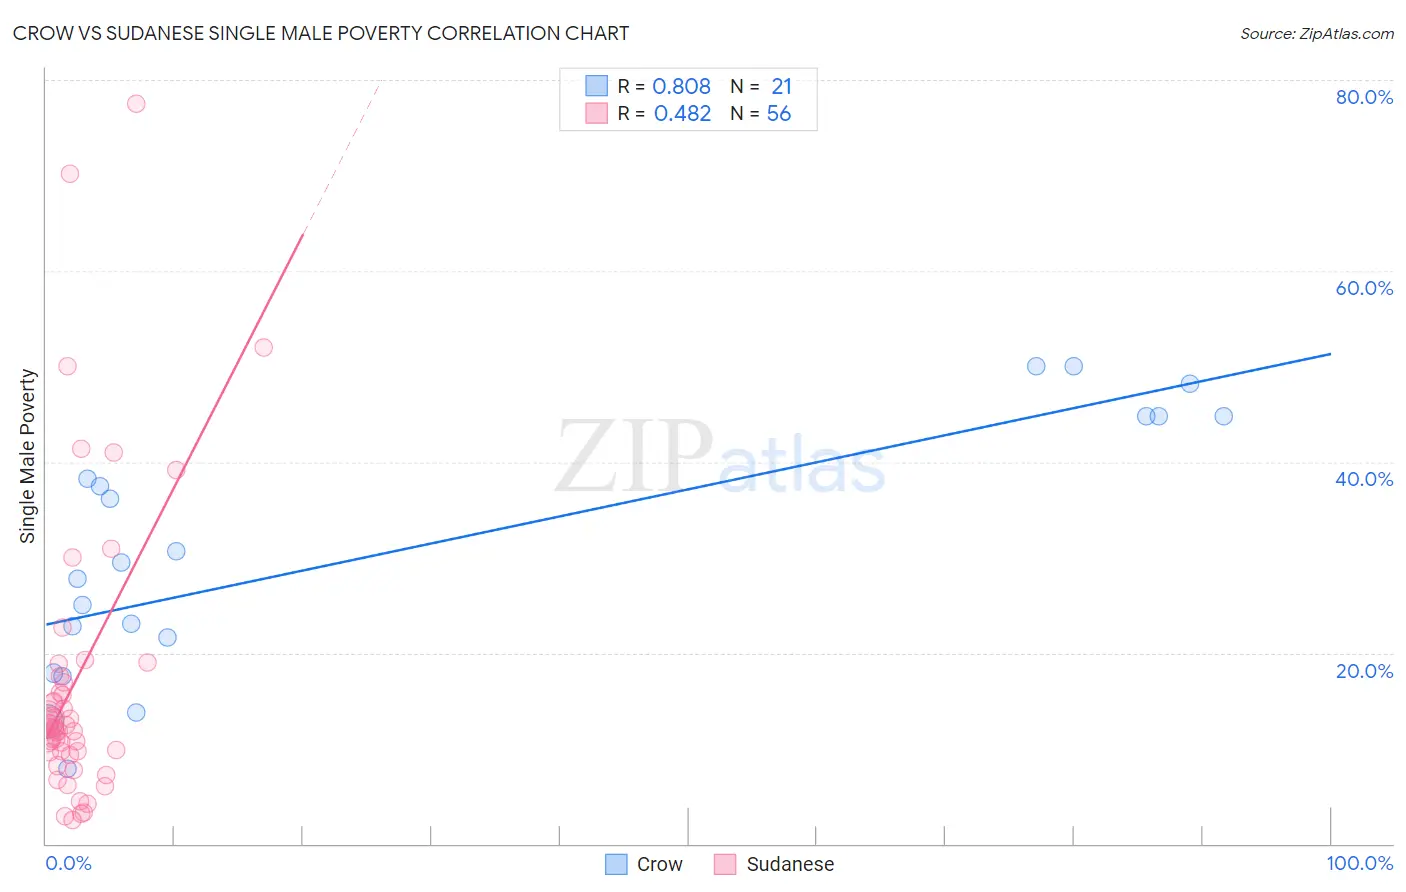
Crow vs Sudanese Single Male Poverty Correlation Chart
The statistical analysis conducted on geographies consisting of 57,394,194 people shows a very strong positive correlation between the proportion of Crow and poverty level among single males in the United States with a correlation coefficient (R) of 0.808 and weighted average of 23.3%. Similarly, the statistical analysis conducted on geographies consisting of 106,028,362 people shows a moderate positive correlation between the proportion of Sudanese and poverty level among single males in the United States with a correlation coefficient (R) of 0.482 and weighted average of 13.1%, a difference of 78.2%.
Single Male Poverty Correlation Summary
| Measurement | Crow | Sudanese |
| Minimum | 7.9% | 2.5% |
| Maximum | 50.0% | 77.6% |
| Range | 42.1% | 75.0% |
| Mean | 30.7% | 17.1% |
| Median | 29.4% | 12.2% |
| Interquartile 25% (IQ1) | 19.7% | 9.6% |
| Interquartile 75% (IQ3) | 44.8% | 17.2% |
| Interquartile Range (IQR) | 25.0% | 7.5% |
| Standard Deviation (Sample) | 13.2% | 15.6% |
| Standard Deviation (Population) | 12.9% | 15.5% |
Similar Demographics by Single Male Poverty
Demographics Similar to Crow by Single Male Poverty
In terms of single male poverty, the demographic groups most similar to Crow are Houma (23.5%, a difference of 0.82%), Sioux (22.2%, a difference of 4.7%), Arapaho (21.9%, a difference of 6.0%), Pueblo (21.6%, a difference of 7.6%), and Puerto Rican (25.1%, a difference of 7.8%).
| Demographics | Rating | Rank | Single Male Poverty |
| Inupiat | 0.0 /100 | #333 | Tragic 20.0% |
| Pima | 0.0 /100 | #334 | Tragic 20.2% |
| Yuman | 0.0 /100 | #335 | Tragic 21.3% |
| Tohono O'odham | 0.0 /100 | #336 | Tragic 21.6% |
| Apache | 0.0 /100 | #337 | Tragic 21.6% |
| Pueblo | 0.0 /100 | #338 | Tragic 21.6% |
| Arapaho | 0.0 /100 | #339 | Tragic 21.9% |
| Sioux | 0.0 /100 | #340 | Tragic 22.2% |
| Crow | 0.0 /100 | #341 | Tragic 23.3% |
| Houma | 0.0 /100 | #342 | Tragic 23.5% |
| Puerto Ricans | 0.0 /100 | #343 | Tragic 25.1% |
| Lumbee | 0.0 /100 | #344 | Tragic 25.2% |
| Navajo | 0.0 /100 | #345 | Tragic 25.3% |
| Hopi | 0.0 /100 | #346 | Tragic 27.5% |
| Yup'ik | 0.0 /100 | #347 | Tragic 31.6% |
Demographics Similar to Sudanese by Single Male Poverty
In terms of single male poverty, the demographic groups most similar to Sudanese are Immigrants from Western Africa (13.1%, a difference of 0.010%), Mexican American Indian (13.1%, a difference of 0.020%), Immigrants from Haiti (13.1%, a difference of 0.080%), Swedish (13.1%, a difference of 0.080%), and Northern European (13.0%, a difference of 0.10%).
| Demographics | Rating | Rank | Single Male Poverty |
| Slovenes | 21.6 /100 | #200 | Fair 13.0% |
| Trinidadians and Tobagonians | 21.4 /100 | #201 | Fair 13.0% |
| Basques | 20.7 /100 | #202 | Fair 13.0% |
| Immigrants | Bangladesh | 20.4 /100 | #203 | Fair 13.0% |
| Estonians | 20.3 /100 | #204 | Fair 13.0% |
| Poles | 19.3 /100 | #205 | Poor 13.0% |
| Northern Europeans | 18.9 /100 | #206 | Poor 13.0% |
| Sudanese | 17.7 /100 | #207 | Poor 13.1% |
| Immigrants | Western Africa | 17.6 /100 | #208 | Poor 13.1% |
| Mexican American Indians | 17.5 /100 | #209 | Poor 13.1% |
| Immigrants | Haiti | 16.8 /100 | #210 | Poor 13.1% |
| Swedes | 16.8 /100 | #211 | Poor 13.1% |
| Senegalese | 16.4 /100 | #212 | Poor 13.1% |
| Italians | 15.9 /100 | #213 | Poor 13.1% |
| Zimbabweans | 14.9 /100 | #214 | Poor 13.1% |