Crow vs Immigrants from Barbados Single Male Poverty
COMPARE
Crow
Immigrants from Barbados
Single Male Poverty
Single Male Poverty Comparison
Crow
Immigrants from Barbados
23.3%
SINGLE MALE POVERTY
0.0/ 100
METRIC RATING
341st/ 347
METRIC RANK
12.7%
SINGLE MALE POVERTY
57.7/ 100
METRIC RATING
168th/ 347
METRIC RANK
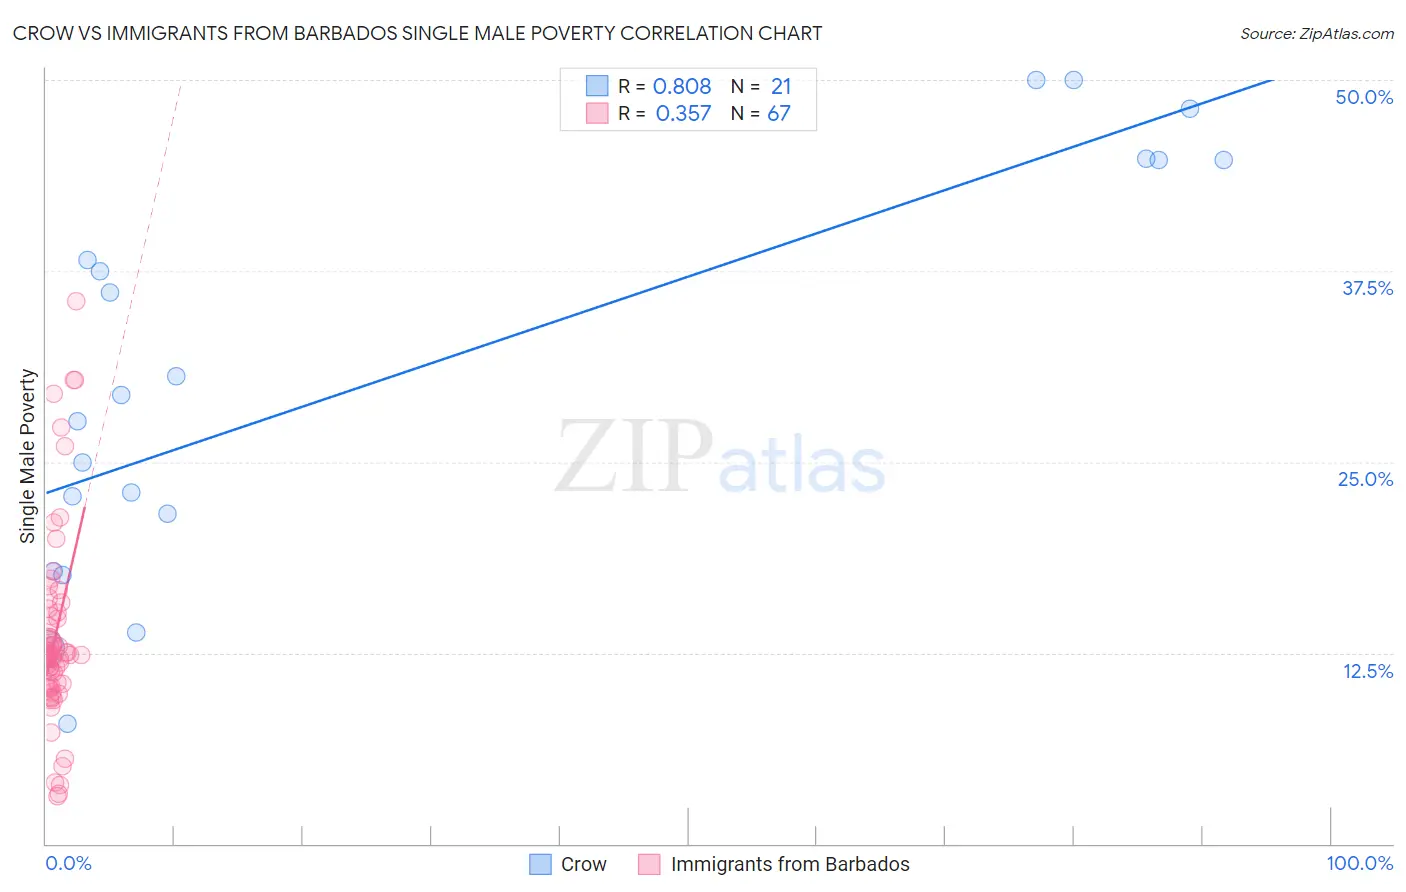
Crow vs Immigrants from Barbados Single Male Poverty Correlation Chart
The statistical analysis conducted on geographies consisting of 57,394,194 people shows a very strong positive correlation between the proportion of Crow and poverty level among single males in the United States with a correlation coefficient (R) of 0.808 and weighted average of 23.3%. Similarly, the statistical analysis conducted on geographies consisting of 108,546,414 people shows a mild positive correlation between the proportion of Immigrants from Barbados and poverty level among single males in the United States with a correlation coefficient (R) of 0.357 and weighted average of 12.7%, a difference of 82.5%.
Single Male Poverty Correlation Summary
| Measurement | Crow | Immigrants from Barbados |
| Minimum | 7.9% | 3.1% |
| Maximum | 50.0% | 35.5% |
| Range | 42.1% | 32.4% |
| Mean | 30.7% | 13.6% |
| Median | 29.4% | 12.4% |
| Interquartile 25% (IQ1) | 19.7% | 10.3% |
| Interquartile 75% (IQ3) | 44.8% | 15.2% |
| Interquartile Range (IQR) | 25.0% | 4.8% |
| Standard Deviation (Sample) | 13.2% | 6.4% |
| Standard Deviation (Population) | 12.9% | 6.3% |
Similar Demographics by Single Male Poverty
Demographics Similar to Crow by Single Male Poverty
In terms of single male poverty, the demographic groups most similar to Crow are Houma (23.5%, a difference of 0.82%), Sioux (22.2%, a difference of 4.7%), Arapaho (21.9%, a difference of 6.0%), Pueblo (21.6%, a difference of 7.6%), and Puerto Rican (25.1%, a difference of 7.8%).
| Demographics | Rating | Rank | Single Male Poverty |
| Inupiat | 0.0 /100 | #333 | Tragic 20.0% |
| Pima | 0.0 /100 | #334 | Tragic 20.2% |
| Yuman | 0.0 /100 | #335 | Tragic 21.3% |
| Tohono O'odham | 0.0 /100 | #336 | Tragic 21.6% |
| Apache | 0.0 /100 | #337 | Tragic 21.6% |
| Pueblo | 0.0 /100 | #338 | Tragic 21.6% |
| Arapaho | 0.0 /100 | #339 | Tragic 21.9% |
| Sioux | 0.0 /100 | #340 | Tragic 22.2% |
| Crow | 0.0 /100 | #341 | Tragic 23.3% |
| Houma | 0.0 /100 | #342 | Tragic 23.5% |
| Puerto Ricans | 0.0 /100 | #343 | Tragic 25.1% |
| Lumbee | 0.0 /100 | #344 | Tragic 25.2% |
| Navajo | 0.0 /100 | #345 | Tragic 25.3% |
| Hopi | 0.0 /100 | #346 | Tragic 27.5% |
| Yup'ik | 0.0 /100 | #347 | Tragic 31.6% |
Demographics Similar to Immigrants from Barbados by Single Male Poverty
In terms of single male poverty, the demographic groups most similar to Immigrants from Barbados are Immigrants from Sudan (12.7%, a difference of 0.030%), Immigrants from Guyana (12.7%, a difference of 0.15%), Puget Sound Salish (12.8%, a difference of 0.18%), Immigrants from Cambodia (12.7%, a difference of 0.25%), and Immigrants from Nigeria (12.7%, a difference of 0.28%).
| Demographics | Rating | Rank | Single Male Poverty |
| Immigrants | Africa | 63.4 /100 | #161 | Good 12.7% |
| Eastern Europeans | 63.3 /100 | #162 | Good 12.7% |
| Palestinians | 63.1 /100 | #163 | Good 12.7% |
| Immigrants | Nigeria | 62.8 /100 | #164 | Good 12.7% |
| Immigrants | Cambodia | 62.2 /100 | #165 | Good 12.7% |
| Immigrants | Guyana | 60.5 /100 | #166 | Good 12.7% |
| Immigrants | Sudan | 58.2 /100 | #167 | Average 12.7% |
| Immigrants | Barbados | 57.7 /100 | #168 | Average 12.7% |
| Puget Sound Salish | 54.3 /100 | #169 | Average 12.8% |
| Guyanese | 52.0 /100 | #170 | Average 12.8% |
| South Africans | 51.5 /100 | #171 | Average 12.8% |
| Danes | 51.4 /100 | #172 | Average 12.8% |
| Immigrants | St. Vincent and the Grenadines | 50.9 /100 | #173 | Average 12.8% |
| Costa Ricans | 50.0 /100 | #174 | Average 12.8% |
| Croatians | 48.9 /100 | #175 | Average 12.8% |