Crow vs Osage Single Male Poverty
COMPARE
Crow
Osage
Single Male Poverty
Single Male Poverty Comparison
Crow
Osage
23.3%
SINGLE MALE POVERTY
0.0/ 100
METRIC RATING
341st/ 347
METRIC RANK
16.5%
SINGLE MALE POVERTY
0.0/ 100
METRIC RATING
321st/ 347
METRIC RANK
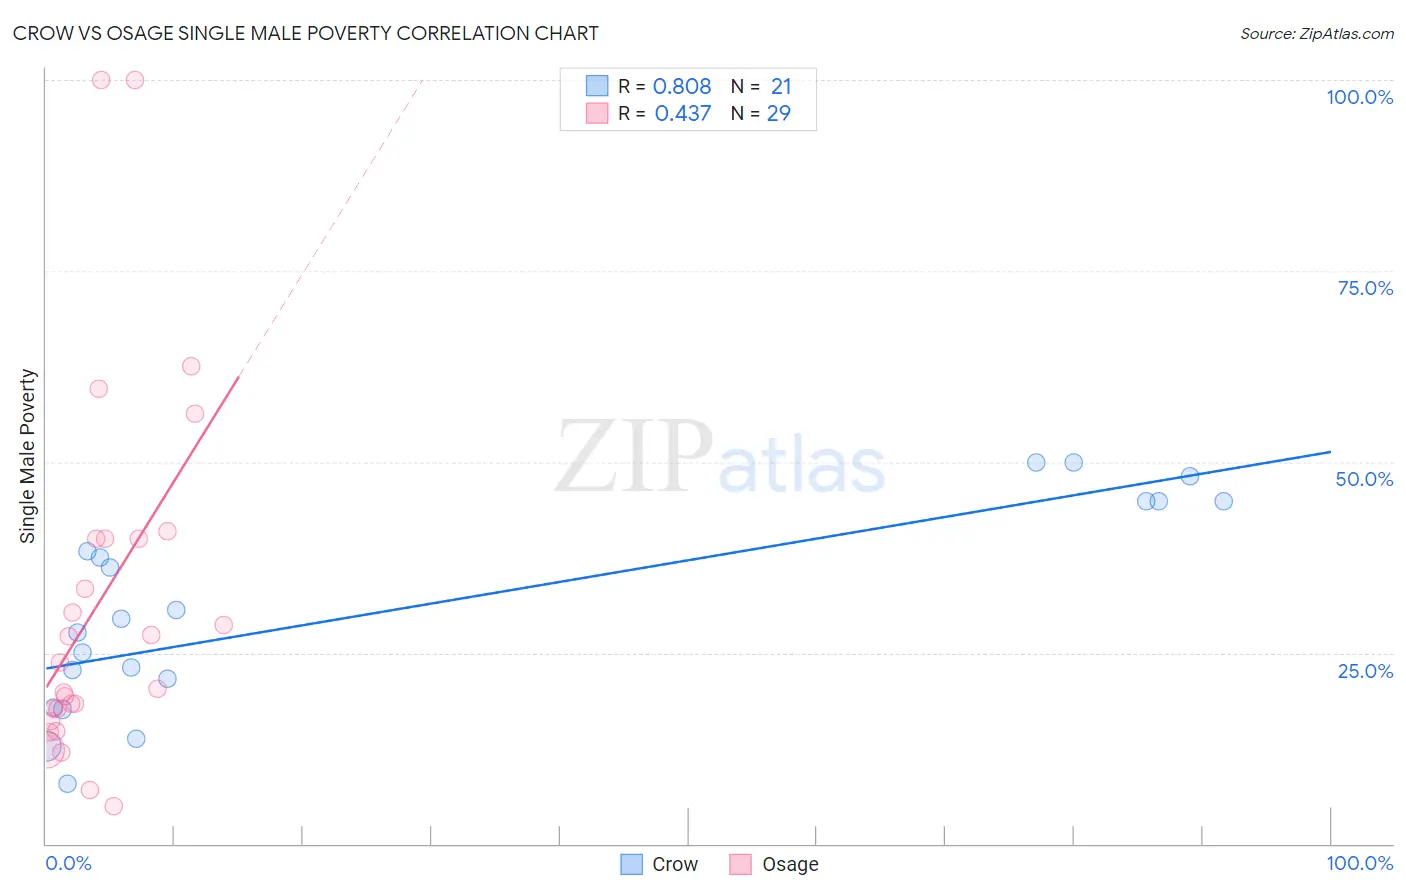
Crow vs Osage Single Male Poverty Correlation Chart
The statistical analysis conducted on geographies consisting of 57,394,194 people shows a very strong positive correlation between the proportion of Crow and poverty level among single males in the United States with a correlation coefficient (R) of 0.808 and weighted average of 23.3%. Similarly, the statistical analysis conducted on geographies consisting of 87,587,587 people shows a moderate positive correlation between the proportion of Osage and poverty level among single males in the United States with a correlation coefficient (R) of 0.437 and weighted average of 16.5%, a difference of 41.3%.
Single Male Poverty Correlation Summary
| Measurement | Crow | Osage |
| Minimum | 7.9% | 5.0% |
| Maximum | 50.0% | 100.0% |
| Range | 42.1% | 95.0% |
| Mean | 30.7% | 31.8% |
| Median | 29.4% | 23.8% |
| Interquartile 25% (IQ1) | 19.7% | 16.9% |
| Interquartile 75% (IQ3) | 44.8% | 40.0% |
| Interquartile Range (IQR) | 25.0% | 23.1% |
| Standard Deviation (Sample) | 13.2% | 24.0% |
| Standard Deviation (Population) | 12.9% | 23.6% |
Demographics Similar to Crow and Osage by Single Male Poverty
In terms of single male poverty, the demographic groups most similar to Crow are Sioux (22.2%, a difference of 4.7%), Arapaho (21.9%, a difference of 6.0%), Pueblo (21.6%, a difference of 7.6%), Apache (21.6%, a difference of 7.8%), and Tohono O'odham (21.6%, a difference of 7.9%). Similarly, the demographic groups most similar to Osage are Shoshone (16.7%, a difference of 1.3%), Creek (16.8%, a difference of 2.3%), Immigrants from Yemen (16.9%, a difference of 2.4%), Choctaw (17.0%, a difference of 3.1%), and Central American Indian (17.2%, a difference of 4.8%).
| Demographics | Rating | Rank | Single Male Poverty |
| Osage | 0.0 /100 | #321 | Tragic 16.5% |
| Shoshone | 0.0 /100 | #322 | Tragic 16.7% |
| Creek | 0.0 /100 | #323 | Tragic 16.8% |
| Immigrants | Yemen | 0.0 /100 | #324 | Tragic 16.9% |
| Choctaw | 0.0 /100 | #325 | Tragic 17.0% |
| Central American Indians | 0.0 /100 | #326 | Tragic 17.2% |
| Menominee | 0.0 /100 | #327 | Tragic 17.7% |
| Kiowa | 0.0 /100 | #328 | Tragic 18.3% |
| Colville | 0.0 /100 | #329 | Tragic 18.4% |
| Cajuns | 0.0 /100 | #330 | Tragic 19.1% |
| Paiute | 0.0 /100 | #331 | Tragic 19.3% |
| Natives/Alaskans | 0.0 /100 | #332 | Tragic 19.6% |
| Inupiat | 0.0 /100 | #333 | Tragic 20.0% |
| Pima | 0.0 /100 | #334 | Tragic 20.2% |
| Yuman | 0.0 /100 | #335 | Tragic 21.3% |
| Tohono O'odham | 0.0 /100 | #336 | Tragic 21.6% |
| Apache | 0.0 /100 | #337 | Tragic 21.6% |
| Pueblo | 0.0 /100 | #338 | Tragic 21.6% |
| Arapaho | 0.0 /100 | #339 | Tragic 21.9% |
| Sioux | 0.0 /100 | #340 | Tragic 22.2% |
| Crow | 0.0 /100 | #341 | Tragic 23.3% |