Crow vs Guyanese Receiving Food Stamps
COMPARE
Crow
Guyanese
Receiving Food Stamps
Receiving Food Stamps Comparison
Crow
Guyanese
13.4%
RECEIVING FOOD STAMPS
1.6/ 100
METRIC RATING
236th/ 347
METRIC RANK
16.7%
RECEIVING FOOD STAMPS
0.0/ 100
METRIC RATING
311th/ 347
METRIC RANK
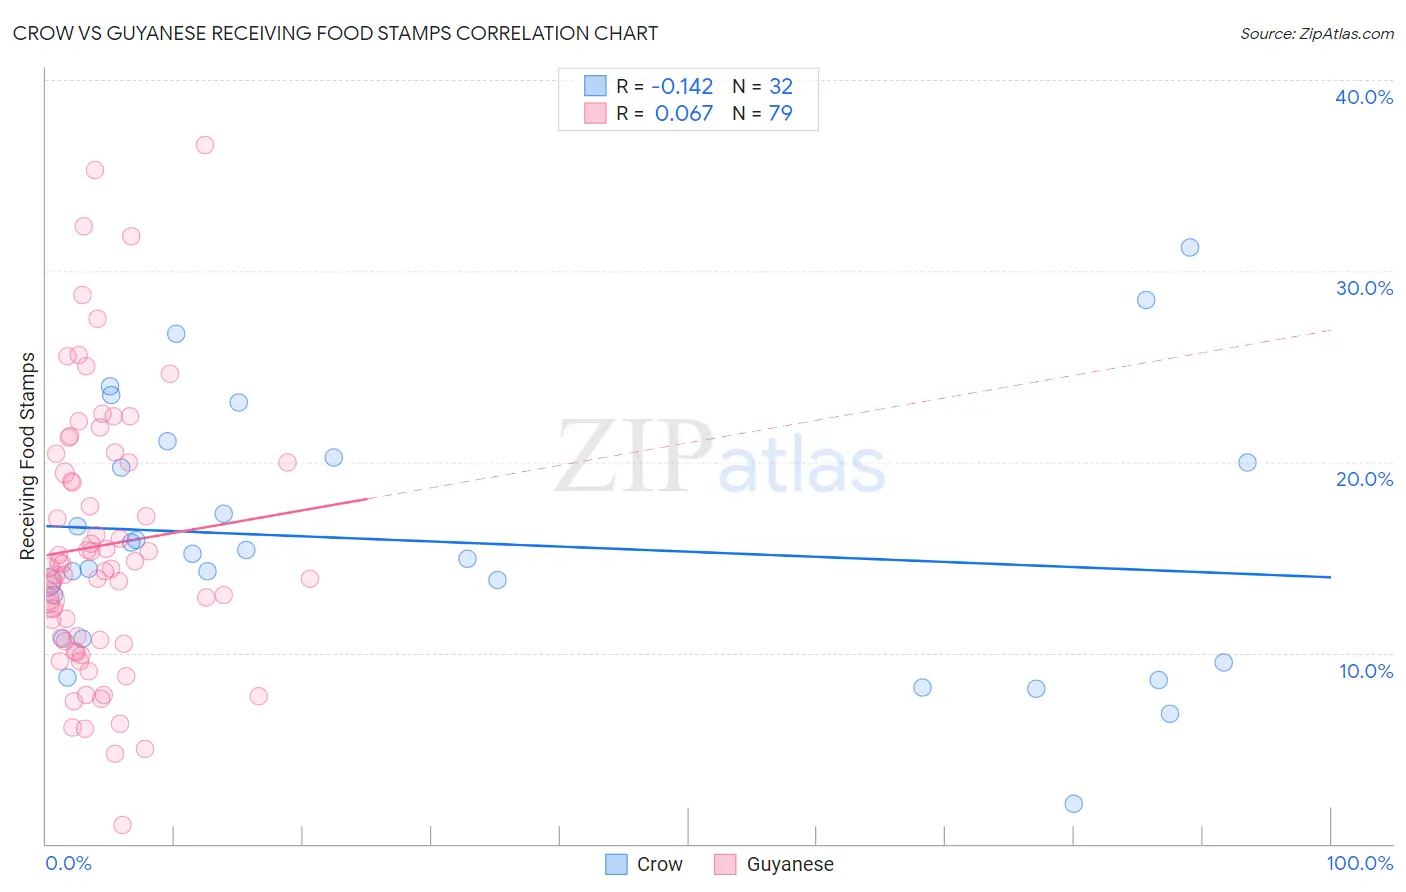
Crow vs Guyanese Receiving Food Stamps Correlation Chart
The statistical analysis conducted on geographies consisting of 59,190,745 people shows a poor negative correlation between the proportion of Crow and percentage of population receiving government assistance and/or food stamps in the United States with a correlation coefficient (R) of -0.142 and weighted average of 13.4%. Similarly, the statistical analysis conducted on geographies consisting of 176,625,032 people shows a slight positive correlation between the proportion of Guyanese and percentage of population receiving government assistance and/or food stamps in the United States with a correlation coefficient (R) of 0.067 and weighted average of 16.7%, a difference of 24.5%.
Receiving Food Stamps Correlation Summary
| Measurement | Crow | Guyanese |
| Minimum | 2.1% | 1.0% |
| Maximum | 31.2% | 36.6% |
| Range | 29.1% | 35.6% |
| Mean | 15.8% | 15.6% |
| Median | 15.0% | 14.4% |
| Interquartile 25% (IQ1) | 10.7% | 10.6% |
| Interquartile 75% (IQ3) | 20.1% | 20.0% |
| Interquartile Range (IQR) | 9.4% | 9.4% |
| Standard Deviation (Sample) | 6.7% | 7.1% |
| Standard Deviation (Population) | 6.6% | 7.1% |
Similar Demographics by Receiving Food Stamps
Demographics Similar to Crow by Receiving Food Stamps
In terms of receiving food stamps, the demographic groups most similar to Crow are Immigrants from El Salvador (13.5%, a difference of 0.22%), French American Indian (13.5%, a difference of 0.42%), Immigrants from Zaire (13.4%, a difference of 0.44%), Immigrants from Micronesia (13.5%, a difference of 0.65%), and Iroquois (13.5%, a difference of 0.95%).
| Demographics | Rating | Rank | Receiving Food Stamps |
| Ottawa | 3.5 /100 | #229 | Tragic 13.1% |
| Puget Sound Salish | 3.4 /100 | #230 | Tragic 13.1% |
| Immigrants | Nigeria | 3.4 /100 | #231 | Tragic 13.1% |
| Salvadorans | 2.7 /100 | #232 | Tragic 13.2% |
| Cherokee | 2.5 /100 | #233 | Tragic 13.2% |
| Comanche | 2.4 /100 | #234 | Tragic 13.3% |
| Immigrants | Zaire | 1.9 /100 | #235 | Tragic 13.4% |
| Crow | 1.6 /100 | #236 | Tragic 13.4% |
| Immigrants | El Salvador | 1.5 /100 | #237 | Tragic 13.5% |
| French American Indians | 1.4 /100 | #238 | Tragic 13.5% |
| Immigrants | Micronesia | 1.3 /100 | #239 | Tragic 13.5% |
| Iroquois | 1.2 /100 | #240 | Tragic 13.5% |
| Choctaw | 1.0 /100 | #241 | Tragic 13.6% |
| Immigrants | Panama | 1.0 /100 | #242 | Tragic 13.6% |
| Somalis | 0.9 /100 | #243 | Tragic 13.7% |
Demographics Similar to Guyanese by Receiving Food Stamps
In terms of receiving food stamps, the demographic groups most similar to Guyanese are Immigrants from Barbados (16.6%, a difference of 0.52%), Sioux (16.8%, a difference of 0.70%), Immigrants from Jamaica (16.9%, a difference of 0.98%), U.S. Virgin Islander (16.5%, a difference of 1.1%), and Immigrants from Guyana (16.9%, a difference of 1.2%).
| Demographics | Rating | Rank | Receiving Food Stamps |
| West Indians | 0.0 /100 | #304 | Tragic 16.3% |
| Immigrants | Azores | 0.0 /100 | #305 | Tragic 16.4% |
| Jamaicans | 0.0 /100 | #306 | Tragic 16.4% |
| Houma | 0.0 /100 | #307 | Tragic 16.5% |
| Barbadians | 0.0 /100 | #308 | Tragic 16.5% |
| U.S. Virgin Islanders | 0.0 /100 | #309 | Tragic 16.5% |
| Immigrants | Barbados | 0.0 /100 | #310 | Tragic 16.6% |
| Guyanese | 0.0 /100 | #311 | Tragic 16.7% |
| Sioux | 0.0 /100 | #312 | Tragic 16.8% |
| Immigrants | Jamaica | 0.0 /100 | #313 | Tragic 16.9% |
| Immigrants | Guyana | 0.0 /100 | #314 | Tragic 16.9% |
| Bahamians | 0.0 /100 | #315 | Tragic 17.0% |
| Central American Indians | 0.0 /100 | #316 | Tragic 17.1% |
| Blacks/African Americans | 0.0 /100 | #317 | Tragic 17.2% |
| Menominee | 0.0 /100 | #318 | Tragic 17.2% |