Croatian vs Czech Receiving Food Stamps
COMPARE
Croatian
Czech
Receiving Food Stamps
Receiving Food Stamps Comparison
Croatians
Czechs
9.6%
RECEIVING FOOD STAMPS
99.5/ 100
METRIC RATING
43rd/ 347
METRIC RANK
9.2%
RECEIVING FOOD STAMPS
99.8/ 100
METRIC RATING
28th/ 347
METRIC RANK
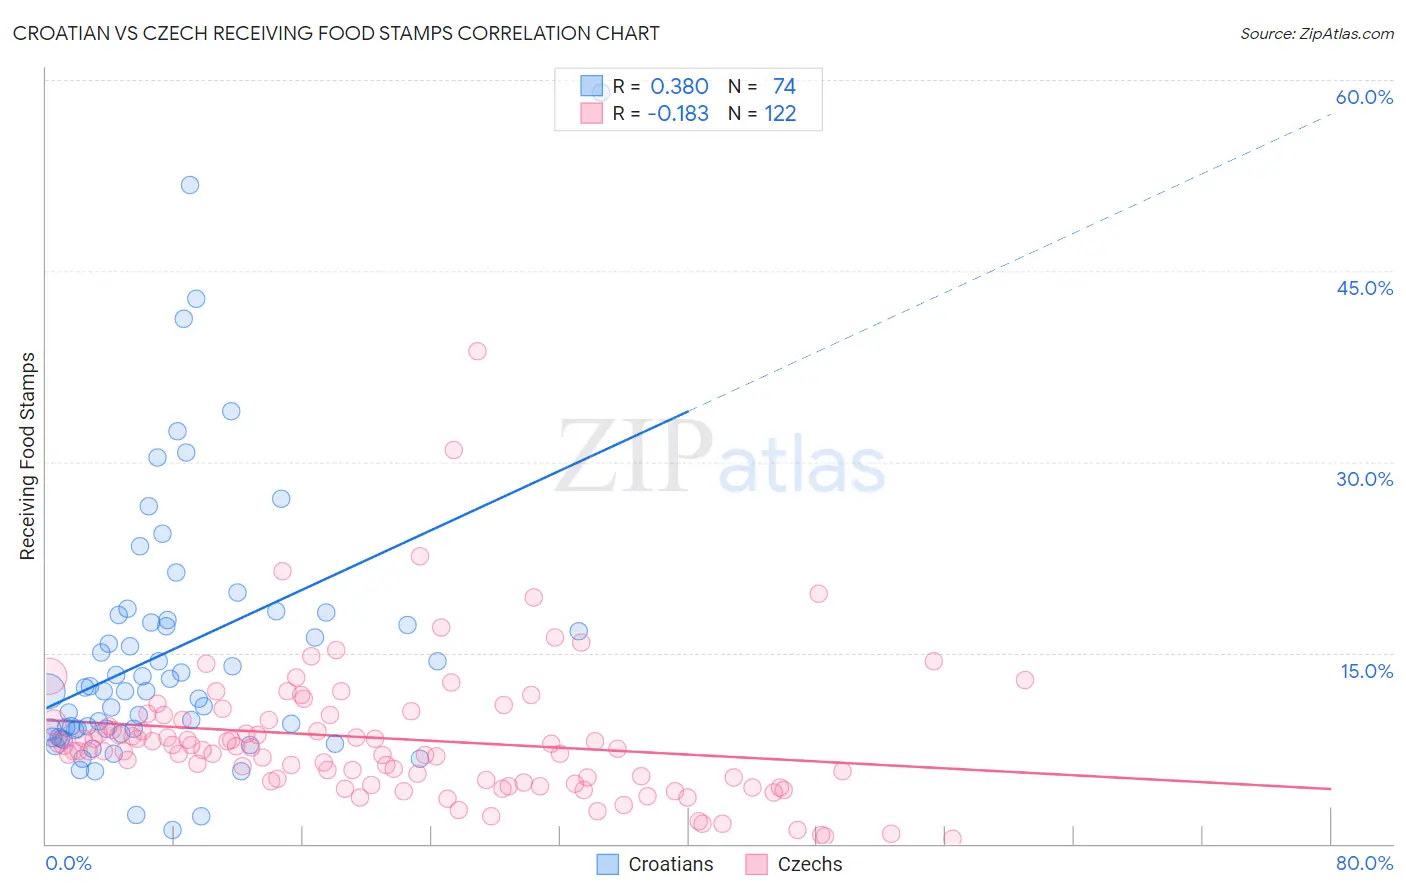
Croatian vs Czech Receiving Food Stamps Correlation Chart
The statistical analysis conducted on geographies consisting of 374,551,597 people shows a mild positive correlation between the proportion of Croatians and percentage of population receiving government assistance and/or food stamps in the United States with a correlation coefficient (R) of 0.380 and weighted average of 9.6%. Similarly, the statistical analysis conducted on geographies consisting of 482,652,589 people shows a poor negative correlation between the proportion of Czechs and percentage of population receiving government assistance and/or food stamps in the United States with a correlation coefficient (R) of -0.183 and weighted average of 9.2%, a difference of 4.0%.
Receiving Food Stamps Correlation Summary
| Measurement | Croatian | Czech |
| Minimum | 1.1% | 0.40% |
| Maximum | 59.0% | 38.7% |
| Range | 57.9% | 38.3% |
| Mean | 15.2% | 8.3% |
| Median | 12.0% | 7.5% |
| Interquartile 25% (IQ1) | 8.9% | 4.9% |
| Interquartile 75% (IQ3) | 17.6% | 9.7% |
| Interquartile Range (IQR) | 8.7% | 4.8% |
| Standard Deviation (Sample) | 10.7% | 5.5% |
| Standard Deviation (Population) | 10.7% | 5.4% |
Demographics Similar to Croatians and Czechs by Receiving Food Stamps
In terms of receiving food stamps, the demographic groups most similar to Croatians are Immigrants from Denmark (9.6%, a difference of 0.23%), Immigrants from Belgium (9.6%, a difference of 0.26%), Immigrants from China (9.6%, a difference of 0.30%), Cambodian (9.5%, a difference of 0.55%), and Immigrants from Netherlands (9.5%, a difference of 0.72%). Similarly, the demographic groups most similar to Czechs are Bhutanese (9.2%, a difference of 0.010%), Swedish (9.2%, a difference of 0.25%), Immigrants from Lithuania (9.2%, a difference of 0.27%), Immigrants from Ireland (9.2%, a difference of 0.45%), and Immigrants from Sweden (9.3%, a difference of 0.64%).
| Demographics | Rating | Rank | Receiving Food Stamps |
| Immigrants | Ireland | 99.8 /100 | #25 | Exceptional 9.2% |
| Swedes | 99.8 /100 | #26 | Exceptional 9.2% |
| Bhutanese | 99.8 /100 | #27 | Exceptional 9.2% |
| Czechs | 99.8 /100 | #28 | Exceptional 9.2% |
| Immigrants | Lithuania | 99.8 /100 | #29 | Exceptional 9.2% |
| Immigrants | Sweden | 99.7 /100 | #30 | Exceptional 9.3% |
| Immigrants | Eastern Asia | 99.7 /100 | #31 | Exceptional 9.3% |
| Bolivians | 99.7 /100 | #32 | Exceptional 9.3% |
| Zimbabweans | 99.6 /100 | #33 | Exceptional 9.5% |
| Turks | 99.6 /100 | #34 | Exceptional 9.5% |
| Immigrants | Austria | 99.6 /100 | #35 | Exceptional 9.5% |
| Estonians | 99.6 /100 | #36 | Exceptional 9.5% |
| Europeans | 99.6 /100 | #37 | Exceptional 9.5% |
| Immigrants | Sri Lanka | 99.5 /100 | #38 | Exceptional 9.5% |
| Immigrants | Bolivia | 99.5 /100 | #39 | Exceptional 9.5% |
| Immigrants | Netherlands | 99.5 /100 | #40 | Exceptional 9.5% |
| Cambodians | 99.5 /100 | #41 | Exceptional 9.5% |
| Immigrants | China | 99.5 /100 | #42 | Exceptional 9.6% |
| Croatians | 99.5 /100 | #43 | Exceptional 9.6% |
| Immigrants | Denmark | 99.4 /100 | #44 | Exceptional 9.6% |
| Immigrants | Belgium | 99.4 /100 | #45 | Exceptional 9.6% |