Comanche vs Immigrants from Saudi Arabia Child Poverty Among Boys Under 16
COMPARE
Comanche
Immigrants from Saudi Arabia
Child Poverty Among Boys Under 16
Child Poverty Among Boys Under 16 Comparison
Comanche
Immigrants from Saudi Arabia
20.1%
CHILD POVERTY AMONG BOYS UNDER 16
0.0/ 100
METRIC RATING
282nd/ 347
METRIC RANK
16.4%
CHILD POVERTY AMONG BOYS UNDER 16
53.6/ 100
METRIC RATING
169th/ 347
METRIC RANK
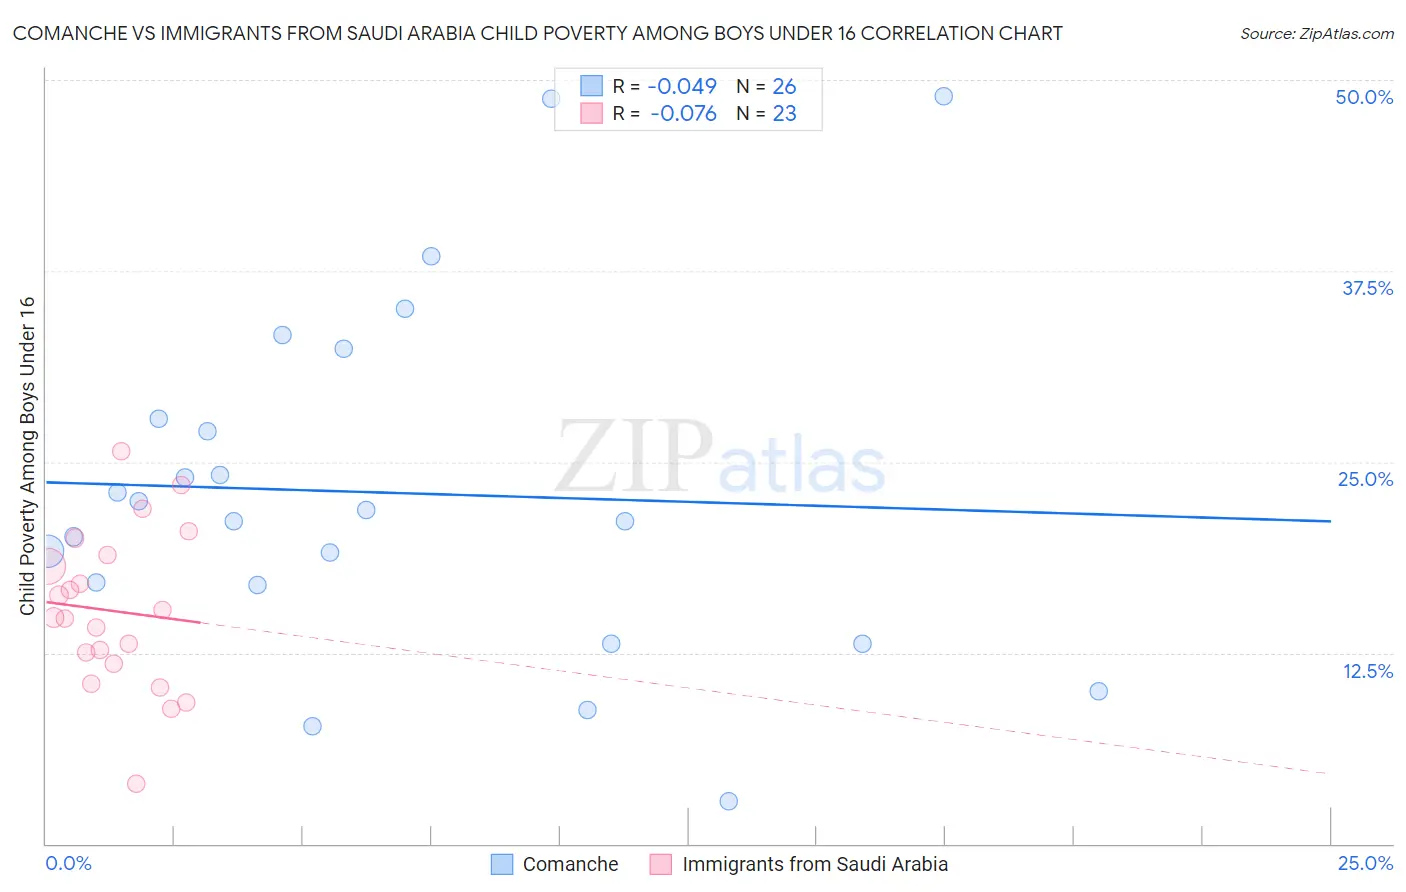
Comanche vs Immigrants from Saudi Arabia Child Poverty Among Boys Under 16 Correlation Chart
The statistical analysis conducted on geographies consisting of 109,333,383 people shows no correlation between the proportion of Comanche and poverty level among boys under the age of 16 in the United States with a correlation coefficient (R) of -0.049 and weighted average of 20.1%. Similarly, the statistical analysis conducted on geographies consisting of 163,294,532 people shows a slight negative correlation between the proportion of Immigrants from Saudi Arabia and poverty level among boys under the age of 16 in the United States with a correlation coefficient (R) of -0.076 and weighted average of 16.4%, a difference of 22.7%.
Child Poverty Among Boys Under 16 Correlation Summary
| Measurement | Comanche | Immigrants from Saudi Arabia |
| Minimum | 2.8% | 3.9% |
| Maximum | 48.9% | 25.7% |
| Range | 46.1% | 21.8% |
| Mean | 23.0% | 15.2% |
| Median | 21.5% | 14.8% |
| Interquartile 25% (IQ1) | 17.0% | 11.8% |
| Interquartile 75% (IQ3) | 27.8% | 18.9% |
| Interquartile Range (IQR) | 10.9% | 7.1% |
| Standard Deviation (Sample) | 11.5% | 5.2% |
| Standard Deviation (Population) | 11.2% | 5.1% |
Similar Demographics by Child Poverty Among Boys Under 16
Demographics Similar to Comanche by Child Poverty Among Boys Under 16
In terms of child poverty among boys under 16, the demographic groups most similar to Comanche are Immigrants from Zaire (20.1%, a difference of 0.050%), Central American (20.1%, a difference of 0.11%), Immigrants from Jamaica (20.1%, a difference of 0.13%), Bangladeshi (20.0%, a difference of 0.23%), and Immigrants from West Indies (20.0%, a difference of 0.36%).
| Demographics | Rating | Rank | Child Poverty Among Boys Under 16 |
| Jamaicans | 0.0 /100 | #275 | Tragic 20.0% |
| Sub-Saharan Africans | 0.0 /100 | #276 | Tragic 20.0% |
| Immigrants | Barbados | 0.0 /100 | #277 | Tragic 20.0% |
| Immigrants | West Indies | 0.0 /100 | #278 | Tragic 20.0% |
| Bangladeshis | 0.0 /100 | #279 | Tragic 20.0% |
| Central Americans | 0.0 /100 | #280 | Tragic 20.1% |
| Immigrants | Zaire | 0.0 /100 | #281 | Tragic 20.1% |
| Comanche | 0.0 /100 | #282 | Tragic 20.1% |
| Immigrants | Jamaica | 0.0 /100 | #283 | Tragic 20.1% |
| Barbadians | 0.0 /100 | #284 | Tragic 20.2% |
| Arapaho | 0.0 /100 | #285 | Tragic 20.2% |
| West Indians | 0.0 /100 | #286 | Tragic 20.3% |
| Immigrants | Belize | 0.0 /100 | #287 | Tragic 20.3% |
| Immigrants | St. Vincent and the Grenadines | 0.0 /100 | #288 | Tragic 20.3% |
| Blackfeet | 0.0 /100 | #289 | Tragic 20.4% |
Demographics Similar to Immigrants from Saudi Arabia by Child Poverty Among Boys Under 16
In terms of child poverty among boys under 16, the demographic groups most similar to Immigrants from Saudi Arabia are South American (16.3%, a difference of 0.19%), Afghan (16.3%, a difference of 0.20%), Immigrants from Bosnia and Herzegovina (16.4%, a difference of 0.21%), Immigrants from Ethiopia (16.4%, a difference of 0.27%), and Immigrants from Colombia (16.4%, a difference of 0.32%).
| Demographics | Rating | Rank | Child Poverty Among Boys Under 16 |
| Guamanians/Chamorros | 69.6 /100 | #162 | Good 16.1% |
| Costa Ricans | 68.1 /100 | #163 | Good 16.1% |
| Immigrants | Albania | 67.9 /100 | #164 | Good 16.1% |
| Colombians | 65.2 /100 | #165 | Good 16.1% |
| Immigrants | Germany | 63.6 /100 | #166 | Good 16.2% |
| Afghans | 55.4 /100 | #167 | Average 16.3% |
| South Americans | 55.3 /100 | #168 | Average 16.3% |
| Immigrants | Saudi Arabia | 53.6 /100 | #169 | Average 16.4% |
| Immigrants | Bosnia and Herzegovina | 51.7 /100 | #170 | Average 16.4% |
| Immigrants | Ethiopia | 51.3 /100 | #171 | Average 16.4% |
| Immigrants | Colombia | 50.8 /100 | #172 | Average 16.4% |
| Tsimshian | 50.5 /100 | #173 | Average 16.4% |
| Uruguayans | 50.0 /100 | #174 | Average 16.4% |
| Immigrants | Syria | 49.0 /100 | #175 | Average 16.5% |
| Whites/Caucasians | 48.2 /100 | #176 | Average 16.5% |