Native Hawaiian vs Immigrants from Saudi Arabia Child Poverty Among Boys Under 16
COMPARE
Native Hawaiian
Immigrants from Saudi Arabia
Child Poverty Among Boys Under 16
Child Poverty Among Boys Under 16 Comparison
Native Hawaiians
Immigrants from Saudi Arabia
15.2%
CHILD POVERTY AMONG BOYS UNDER 16
93.4/ 100
METRIC RATING
118th/ 347
METRIC RANK
16.4%
CHILD POVERTY AMONG BOYS UNDER 16
53.6/ 100
METRIC RATING
169th/ 347
METRIC RANK
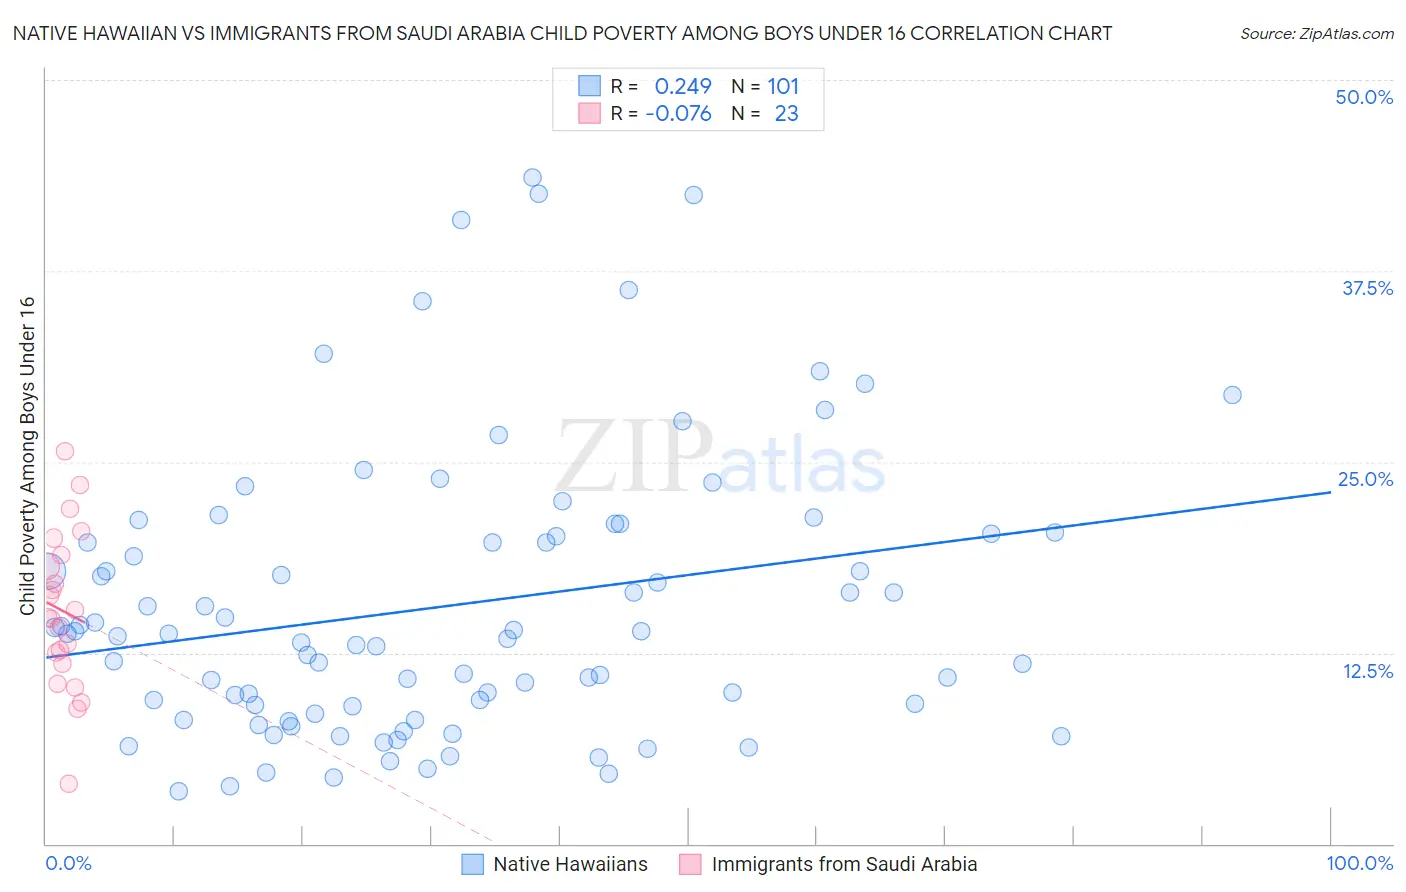
Native Hawaiian vs Immigrants from Saudi Arabia Child Poverty Among Boys Under 16 Correlation Chart
The statistical analysis conducted on geographies consisting of 328,514,795 people shows a weak positive correlation between the proportion of Native Hawaiians and poverty level among boys under the age of 16 in the United States with a correlation coefficient (R) of 0.249 and weighted average of 15.2%. Similarly, the statistical analysis conducted on geographies consisting of 163,294,532 people shows a slight negative correlation between the proportion of Immigrants from Saudi Arabia and poverty level among boys under the age of 16 in the United States with a correlation coefficient (R) of -0.076 and weighted average of 16.4%, a difference of 7.5%.
Child Poverty Among Boys Under 16 Correlation Summary
| Measurement | Native Hawaiian | Immigrants from Saudi Arabia |
| Minimum | 3.5% | 3.9% |
| Maximum | 43.7% | 25.7% |
| Range | 40.2% | 21.8% |
| Mean | 15.6% | 15.2% |
| Median | 13.7% | 14.8% |
| Interquartile 25% (IQ1) | 8.7% | 11.8% |
| Interquartile 75% (IQ3) | 20.2% | 18.9% |
| Interquartile Range (IQR) | 11.5% | 7.1% |
| Standard Deviation (Sample) | 9.2% | 5.2% |
| Standard Deviation (Population) | 9.1% | 5.1% |
Similar Demographics by Child Poverty Among Boys Under 16
Demographics Similar to Native Hawaiians by Child Poverty Among Boys Under 16
In terms of child poverty among boys under 16, the demographic groups most similar to Native Hawaiians are Immigrants from Vietnam (15.2%, a difference of 0.050%), Immigrants from South Eastern Asia (15.2%, a difference of 0.080%), Armenian (15.2%, a difference of 0.12%), Belgian (15.2%, a difference of 0.12%), and Immigrants from Ukraine (15.2%, a difference of 0.13%).
| Demographics | Rating | Rank | Child Poverty Among Boys Under 16 |
| Immigrants | Zimbabwe | 94.2 /100 | #111 | Exceptional 15.2% |
| Basques | 93.8 /100 | #112 | Exceptional 15.2% |
| Irish | 93.8 /100 | #113 | Exceptional 15.2% |
| Immigrants | Ukraine | 93.6 /100 | #114 | Exceptional 15.2% |
| Armenians | 93.6 /100 | #115 | Exceptional 15.2% |
| Immigrants | South Eastern Asia | 93.5 /100 | #116 | Exceptional 15.2% |
| Immigrants | Vietnam | 93.5 /100 | #117 | Exceptional 15.2% |
| Native Hawaiians | 93.4 /100 | #118 | Exceptional 15.2% |
| Belgians | 93.1 /100 | #119 | Exceptional 15.2% |
| South Africans | 93.0 /100 | #120 | Exceptional 15.2% |
| Scottish | 93.0 /100 | #121 | Exceptional 15.2% |
| Immigrants | Malaysia | 92.8 /100 | #122 | Exceptional 15.3% |
| Immigrants | Norway | 92.3 /100 | #123 | Exceptional 15.3% |
| Tlingit-Haida | 92.2 /100 | #124 | Exceptional 15.3% |
| Czechoslovakians | 92.1 /100 | #125 | Exceptional 15.3% |
Demographics Similar to Immigrants from Saudi Arabia by Child Poverty Among Boys Under 16
In terms of child poverty among boys under 16, the demographic groups most similar to Immigrants from Saudi Arabia are South American (16.3%, a difference of 0.19%), Afghan (16.3%, a difference of 0.20%), Immigrants from Bosnia and Herzegovina (16.4%, a difference of 0.21%), Immigrants from Ethiopia (16.4%, a difference of 0.27%), and Immigrants from Colombia (16.4%, a difference of 0.32%).
| Demographics | Rating | Rank | Child Poverty Among Boys Under 16 |
| Guamanians/Chamorros | 69.6 /100 | #162 | Good 16.1% |
| Costa Ricans | 68.1 /100 | #163 | Good 16.1% |
| Immigrants | Albania | 67.9 /100 | #164 | Good 16.1% |
| Colombians | 65.2 /100 | #165 | Good 16.1% |
| Immigrants | Germany | 63.6 /100 | #166 | Good 16.2% |
| Afghans | 55.4 /100 | #167 | Average 16.3% |
| South Americans | 55.3 /100 | #168 | Average 16.3% |
| Immigrants | Saudi Arabia | 53.6 /100 | #169 | Average 16.4% |
| Immigrants | Bosnia and Herzegovina | 51.7 /100 | #170 | Average 16.4% |
| Immigrants | Ethiopia | 51.3 /100 | #171 | Average 16.4% |
| Immigrants | Colombia | 50.8 /100 | #172 | Average 16.4% |
| Tsimshian | 50.5 /100 | #173 | Average 16.4% |
| Uruguayans | 50.0 /100 | #174 | Average 16.4% |
| Immigrants | Syria | 49.0 /100 | #175 | Average 16.5% |
| Whites/Caucasians | 48.2 /100 | #176 | Average 16.5% |