Chinese vs Welsh Seniors Poverty Over the Age of 75
COMPARE
Chinese
Welsh
Seniors Poverty Over the Age of 75
Seniors Poverty Over the Age of 75 Comparison
Chinese
Welsh
9.1%
SENIORS POVERTY OVER THE AGE OF 75
100.0/ 100
METRIC RATING
1st/ 347
METRIC RANK
10.5%
SENIORS POVERTY OVER THE AGE OF 75
99.9/ 100
METRIC RATING
18th/ 347
METRIC RANK
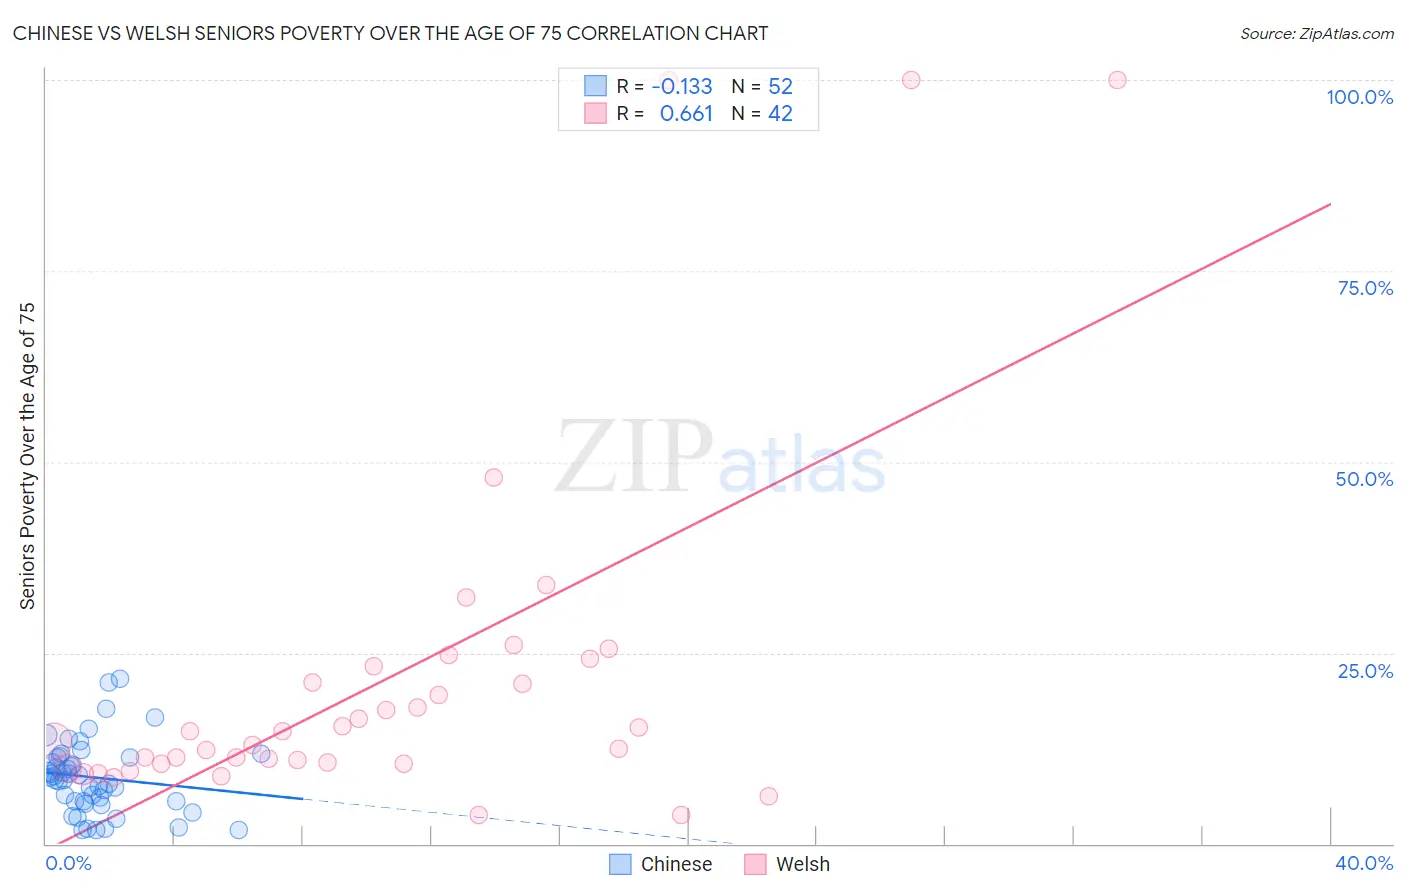
Chinese vs Welsh Seniors Poverty Over the Age of 75 Correlation Chart
The statistical analysis conducted on geographies consisting of 64,532,572 people shows a poor negative correlation between the proportion of Chinese and poverty level among seniors over the age of 75 in the United States with a correlation coefficient (R) of -0.133 and weighted average of 9.1%. Similarly, the statistical analysis conducted on geographies consisting of 515,966,529 people shows a significant positive correlation between the proportion of Welsh and poverty level among seniors over the age of 75 in the United States with a correlation coefficient (R) of 0.661 and weighted average of 10.5%, a difference of 16.3%.
Seniors Poverty Over the Age of 75 Correlation Summary
| Measurement | Chinese | Welsh |
| Minimum | 1.7% | 3.7% |
| Maximum | 21.6% | 100.0% |
| Range | 19.9% | 96.3% |
| Mean | 8.7% | 21.9% |
| Median | 8.6% | 14.1% |
| Interquartile 25% (IQ1) | 5.5% | 10.4% |
| Interquartile 75% (IQ3) | 11.3% | 23.3% |
| Interquartile Range (IQR) | 5.8% | 12.8% |
| Standard Deviation (Sample) | 4.7% | 23.5% |
| Standard Deviation (Population) | 4.6% | 23.3% |
Demographics Similar to Chinese and Welsh by Seniors Poverty Over the Age of 75
In terms of seniors poverty over the age of 75, the demographic groups most similar to Chinese are Tlingit-Haida (9.7%, a difference of 7.0%), Native Hawaiian (10.1%, a difference of 11.1%), Swedish (10.2%, a difference of 12.0%), Norwegian (10.2%, a difference of 12.4%), and Danish (10.2%, a difference of 12.8%). Similarly, the demographic groups most similar to Welsh are Slovak (10.5%, a difference of 0.010%), Immigrants from Scotland (10.5%, a difference of 0.040%), Czech (10.5%, a difference of 0.050%), Dutch (10.5%, a difference of 0.21%), and Scottish (10.5%, a difference of 0.33%).
| Demographics | Rating | Rank | Seniors Poverty Over the Age of 75 |
| Chinese | 100.0 /100 | #1 | Exceptional 9.1% |
| Tlingit-Haida | 100.0 /100 | #2 | Exceptional 9.7% |
| Native Hawaiians | 100.0 /100 | #3 | Exceptional 10.1% |
| Swedes | 100.0 /100 | #4 | Exceptional 10.2% |
| Norwegians | 100.0 /100 | #5 | Exceptional 10.2% |
| Danes | 100.0 /100 | #6 | Exceptional 10.2% |
| Maltese | 100.0 /100 | #7 | Exceptional 10.3% |
| Germans | 99.9 /100 | #8 | Exceptional 10.4% |
| English | 99.9 /100 | #9 | Exceptional 10.4% |
| Scandinavians | 99.9 /100 | #10 | Exceptional 10.4% |
| Immigrants | India | 99.9 /100 | #11 | Exceptional 10.4% |
| Tongans | 99.9 /100 | #12 | Exceptional 10.5% |
| Croatians | 99.9 /100 | #13 | Exceptional 10.5% |
| Scottish | 99.9 /100 | #14 | Exceptional 10.5% |
| Europeans | 99.9 /100 | #15 | Exceptional 10.5% |
| Dutch | 99.9 /100 | #16 | Exceptional 10.5% |
| Slovaks | 99.9 /100 | #17 | Exceptional 10.5% |
| Welsh | 99.9 /100 | #18 | Exceptional 10.5% |
| Immigrants | Scotland | 99.9 /100 | #19 | Exceptional 10.5% |
| Czechs | 99.9 /100 | #20 | Exceptional 10.5% |