Chinese vs Colville Seniors Poverty Over the Age of 75
COMPARE
Chinese
Colville
Seniors Poverty Over the Age of 75
Seniors Poverty Over the Age of 75 Comparison
Chinese
Colville
9.1%
SENIORS POVERTY OVER THE AGE OF 75
100.0/ 100
METRIC RATING
1st/ 347
METRIC RANK
15.2%
SENIORS POVERTY OVER THE AGE OF 75
0.0/ 100
METRIC RATING
292nd/ 347
METRIC RANK
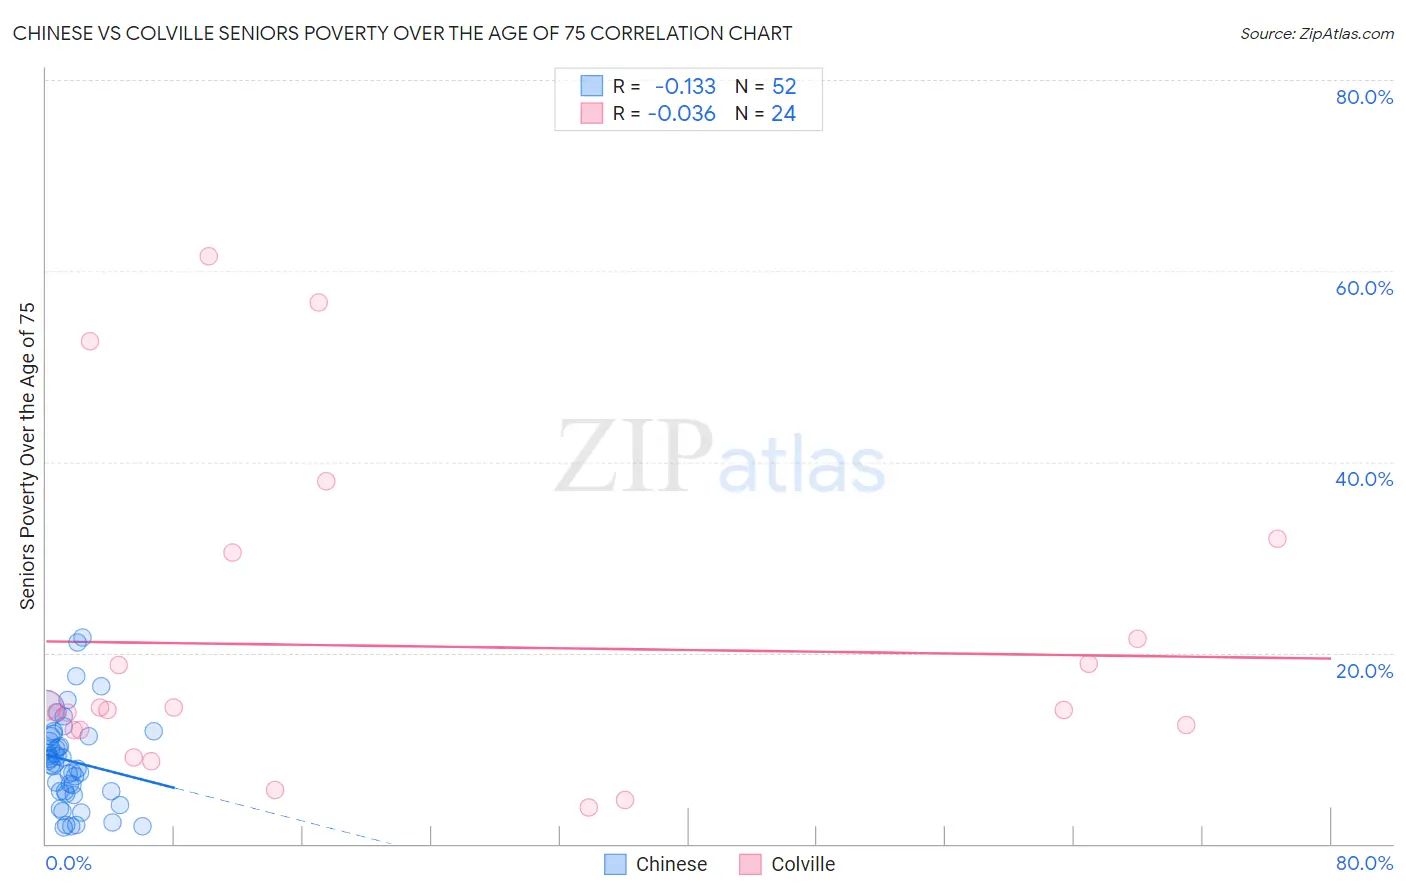
Chinese vs Colville Seniors Poverty Over the Age of 75 Correlation Chart
The statistical analysis conducted on geographies consisting of 64,532,572 people shows a poor negative correlation between the proportion of Chinese and poverty level among seniors over the age of 75 in the United States with a correlation coefficient (R) of -0.133 and weighted average of 9.1%. Similarly, the statistical analysis conducted on geographies consisting of 34,564,944 people shows no correlation between the proportion of Colville and poverty level among seniors over the age of 75 in the United States with a correlation coefficient (R) of -0.036 and weighted average of 15.2%, a difference of 67.8%.
Seniors Poverty Over the Age of 75 Correlation Summary
| Measurement | Chinese | Colville |
| Minimum | 1.7% | 3.7% |
| Maximum | 21.6% | 61.5% |
| Range | 19.9% | 57.8% |
| Mean | 8.7% | 20.7% |
| Median | 8.6% | 14.1% |
| Interquartile 25% (IQ1) | 5.5% | 11.9% |
| Interquartile 75% (IQ3) | 11.3% | 26.0% |
| Interquartile Range (IQR) | 5.8% | 14.1% |
| Standard Deviation (Sample) | 4.7% | 16.3% |
| Standard Deviation (Population) | 4.6% | 15.9% |
Similar Demographics by Seniors Poverty Over the Age of 75
Demographics Similar to Chinese by Seniors Poverty Over the Age of 75
In terms of seniors poverty over the age of 75, the demographic groups most similar to Chinese are Tlingit-Haida (9.7%, a difference of 7.0%), Native Hawaiian (10.1%, a difference of 11.1%), Swedish (10.2%, a difference of 12.0%), Norwegian (10.2%, a difference of 12.4%), and Danish (10.2%, a difference of 12.8%).
| Demographics | Rating | Rank | Seniors Poverty Over the Age of 75 |
| Chinese | 100.0 /100 | #1 | Exceptional 9.1% |
| Tlingit-Haida | 100.0 /100 | #2 | Exceptional 9.7% |
| Native Hawaiians | 100.0 /100 | #3 | Exceptional 10.1% |
| Swedes | 100.0 /100 | #4 | Exceptional 10.2% |
| Norwegians | 100.0 /100 | #5 | Exceptional 10.2% |
| Danes | 100.0 /100 | #6 | Exceptional 10.2% |
| Maltese | 100.0 /100 | #7 | Exceptional 10.3% |
| Germans | 99.9 /100 | #8 | Exceptional 10.4% |
| English | 99.9 /100 | #9 | Exceptional 10.4% |
| Scandinavians | 99.9 /100 | #10 | Exceptional 10.4% |
| Immigrants | India | 99.9 /100 | #11 | Exceptional 10.4% |
| Tongans | 99.9 /100 | #12 | Exceptional 10.5% |
| Croatians | 99.9 /100 | #13 | Exceptional 10.5% |
| Scottish | 99.9 /100 | #14 | Exceptional 10.5% |
| Europeans | 99.9 /100 | #15 | Exceptional 10.5% |
Demographics Similar to Colville by Seniors Poverty Over the Age of 75
In terms of seniors poverty over the age of 75, the demographic groups most similar to Colville are Paiute (15.2%, a difference of 0.18%), Immigrants from the Azores (15.2%, a difference of 0.20%), Immigrants from Belize (15.2%, a difference of 0.22%), Apache (15.3%, a difference of 0.40%), and Jamaican (15.1%, a difference of 0.48%).
| Demographics | Rating | Rank | Seniors Poverty Over the Age of 75 |
| Immigrants | Mexico | 0.0 /100 | #285 | Tragic 14.9% |
| Immigrants | Central America | 0.0 /100 | #286 | Tragic 15.0% |
| Immigrants | Guatemala | 0.0 /100 | #287 | Tragic 15.1% |
| Jamaicans | 0.0 /100 | #288 | Tragic 15.1% |
| Immigrants | Belize | 0.0 /100 | #289 | Tragic 15.2% |
| Immigrants | Azores | 0.0 /100 | #290 | Tragic 15.2% |
| Paiute | 0.0 /100 | #291 | Tragic 15.2% |
| Colville | 0.0 /100 | #292 | Tragic 15.2% |
| Apache | 0.0 /100 | #293 | Tragic 15.3% |
| Immigrants | Jamaica | 0.0 /100 | #294 | Tragic 15.3% |
| U.S. Virgin Islanders | 0.0 /100 | #295 | Tragic 15.4% |
| Yuman | 0.0 /100 | #296 | Tragic 15.4% |
| Hondurans | 0.0 /100 | #297 | Tragic 15.4% |
| Natives/Alaskans | 0.0 /100 | #298 | Tragic 15.5% |
| Spanish American Indians | 0.0 /100 | #299 | Tragic 15.5% |