Chinese vs Colombian Seniors Poverty Over the Age of 75
COMPARE
Chinese
Colombian
Seniors Poverty Over the Age of 75
Seniors Poverty Over the Age of 75 Comparison
Chinese
Colombians
9.1%
SENIORS POVERTY OVER THE AGE OF 75
100.0/ 100
METRIC RATING
1st/ 347
METRIC RANK
14.3%
SENIORS POVERTY OVER THE AGE OF 75
0.0/ 100
METRIC RATING
268th/ 347
METRIC RANK
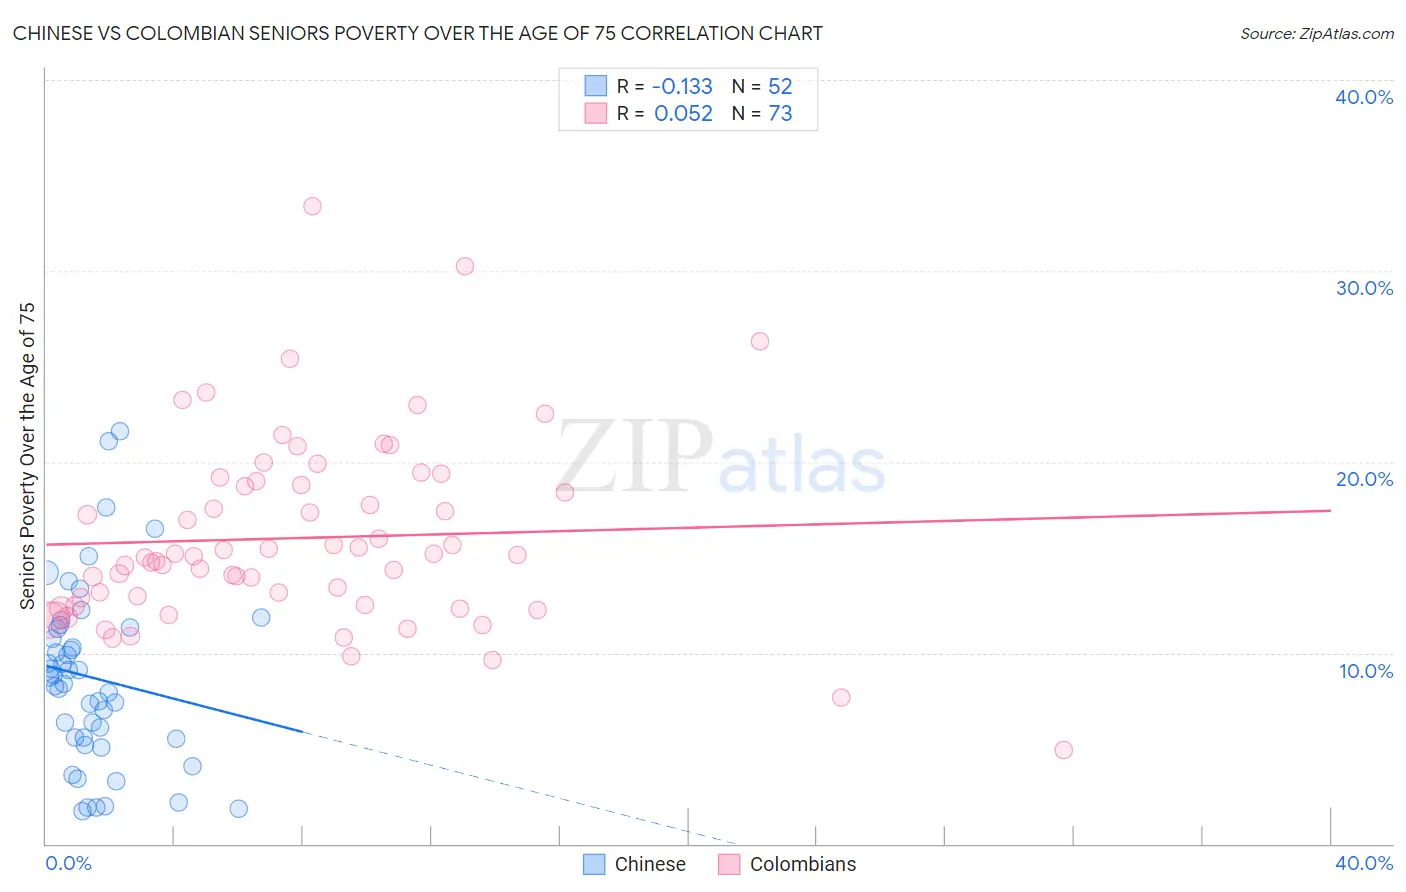
Chinese vs Colombian Seniors Poverty Over the Age of 75 Correlation Chart
The statistical analysis conducted on geographies consisting of 64,532,572 people shows a poor negative correlation between the proportion of Chinese and poverty level among seniors over the age of 75 in the United States with a correlation coefficient (R) of -0.133 and weighted average of 9.1%. Similarly, the statistical analysis conducted on geographies consisting of 414,244,139 people shows a slight positive correlation between the proportion of Colombians and poverty level among seniors over the age of 75 in the United States with a correlation coefficient (R) of 0.052 and weighted average of 14.3%, a difference of 57.2%.
Seniors Poverty Over the Age of 75 Correlation Summary
| Measurement | Chinese | Colombian |
| Minimum | 1.7% | 4.9% |
| Maximum | 21.6% | 33.4% |
| Range | 19.9% | 28.4% |
| Mean | 8.7% | 16.0% |
| Median | 8.6% | 15.1% |
| Interquartile 25% (IQ1) | 5.5% | 12.5% |
| Interquartile 75% (IQ3) | 11.3% | 18.9% |
| Interquartile Range (IQR) | 5.8% | 6.4% |
| Standard Deviation (Sample) | 4.7% | 4.9% |
| Standard Deviation (Population) | 4.6% | 4.9% |
Similar Demographics by Seniors Poverty Over the Age of 75
Demographics Similar to Chinese by Seniors Poverty Over the Age of 75
In terms of seniors poverty over the age of 75, the demographic groups most similar to Chinese are Tlingit-Haida (9.7%, a difference of 7.0%), Native Hawaiian (10.1%, a difference of 11.1%), Swedish (10.2%, a difference of 12.0%), Norwegian (10.2%, a difference of 12.4%), and Danish (10.2%, a difference of 12.8%).
| Demographics | Rating | Rank | Seniors Poverty Over the Age of 75 |
| Chinese | 100.0 /100 | #1 | Exceptional 9.1% |
| Tlingit-Haida | 100.0 /100 | #2 | Exceptional 9.7% |
| Native Hawaiians | 100.0 /100 | #3 | Exceptional 10.1% |
| Swedes | 100.0 /100 | #4 | Exceptional 10.2% |
| Norwegians | 100.0 /100 | #5 | Exceptional 10.2% |
| Danes | 100.0 /100 | #6 | Exceptional 10.2% |
| Maltese | 100.0 /100 | #7 | Exceptional 10.3% |
| Germans | 99.9 /100 | #8 | Exceptional 10.4% |
| English | 99.9 /100 | #9 | Exceptional 10.4% |
| Scandinavians | 99.9 /100 | #10 | Exceptional 10.4% |
| Immigrants | India | 99.9 /100 | #11 | Exceptional 10.4% |
| Tongans | 99.9 /100 | #12 | Exceptional 10.5% |
| Croatians | 99.9 /100 | #13 | Exceptional 10.5% |
| Scottish | 99.9 /100 | #14 | Exceptional 10.5% |
| Europeans | 99.9 /100 | #15 | Exceptional 10.5% |
Demographics Similar to Colombians by Seniors Poverty Over the Age of 75
In terms of seniors poverty over the age of 75, the demographic groups most similar to Colombians are Immigrants from Venezuela (14.3%, a difference of 0.11%), Immigrants from Uruguay (14.3%, a difference of 0.25%), Venezuelan (14.2%, a difference of 0.35%), Armenian (14.2%, a difference of 0.36%), and Salvadoran (14.2%, a difference of 0.58%).
| Demographics | Rating | Rank | Seniors Poverty Over the Age of 75 |
| Ghanaians | 0.1 /100 | #261 | Tragic 14.0% |
| Cajuns | 0.1 /100 | #262 | Tragic 14.0% |
| Iroquois | 0.1 /100 | #263 | Tragic 14.0% |
| South Americans | 0.0 /100 | #264 | Tragic 14.1% |
| Salvadorans | 0.0 /100 | #265 | Tragic 14.2% |
| Armenians | 0.0 /100 | #266 | Tragic 14.2% |
| Venezuelans | 0.0 /100 | #267 | Tragic 14.2% |
| Colombians | 0.0 /100 | #268 | Tragic 14.3% |
| Immigrants | Venezuela | 0.0 /100 | #269 | Tragic 14.3% |
| Immigrants | Uruguay | 0.0 /100 | #270 | Tragic 14.3% |
| Immigrants | Ghana | 0.0 /100 | #271 | Tragic 14.4% |
| Mexicans | 0.0 /100 | #272 | Tragic 14.4% |
| Immigrants | South America | 0.0 /100 | #273 | Tragic 14.4% |
| Immigrants | Bahamas | 0.0 /100 | #274 | Tragic 14.4% |
| Immigrants | El Salvador | 0.0 /100 | #275 | Tragic 14.5% |