Chinese vs Tohono O'odham Single Mother Poverty
COMPARE
Chinese
Tohono O'odham
Single Mother Poverty
Single Mother Poverty Comparison
Chinese
Tohono O'odham
24.6%
SINGLE MOTHER POVERTY
100.0/ 100
METRIC RATING
7th/ 347
METRIC RANK
43.0%
SINGLE MOTHER POVERTY
0.0/ 100
METRIC RATING
344th/ 347
METRIC RANK
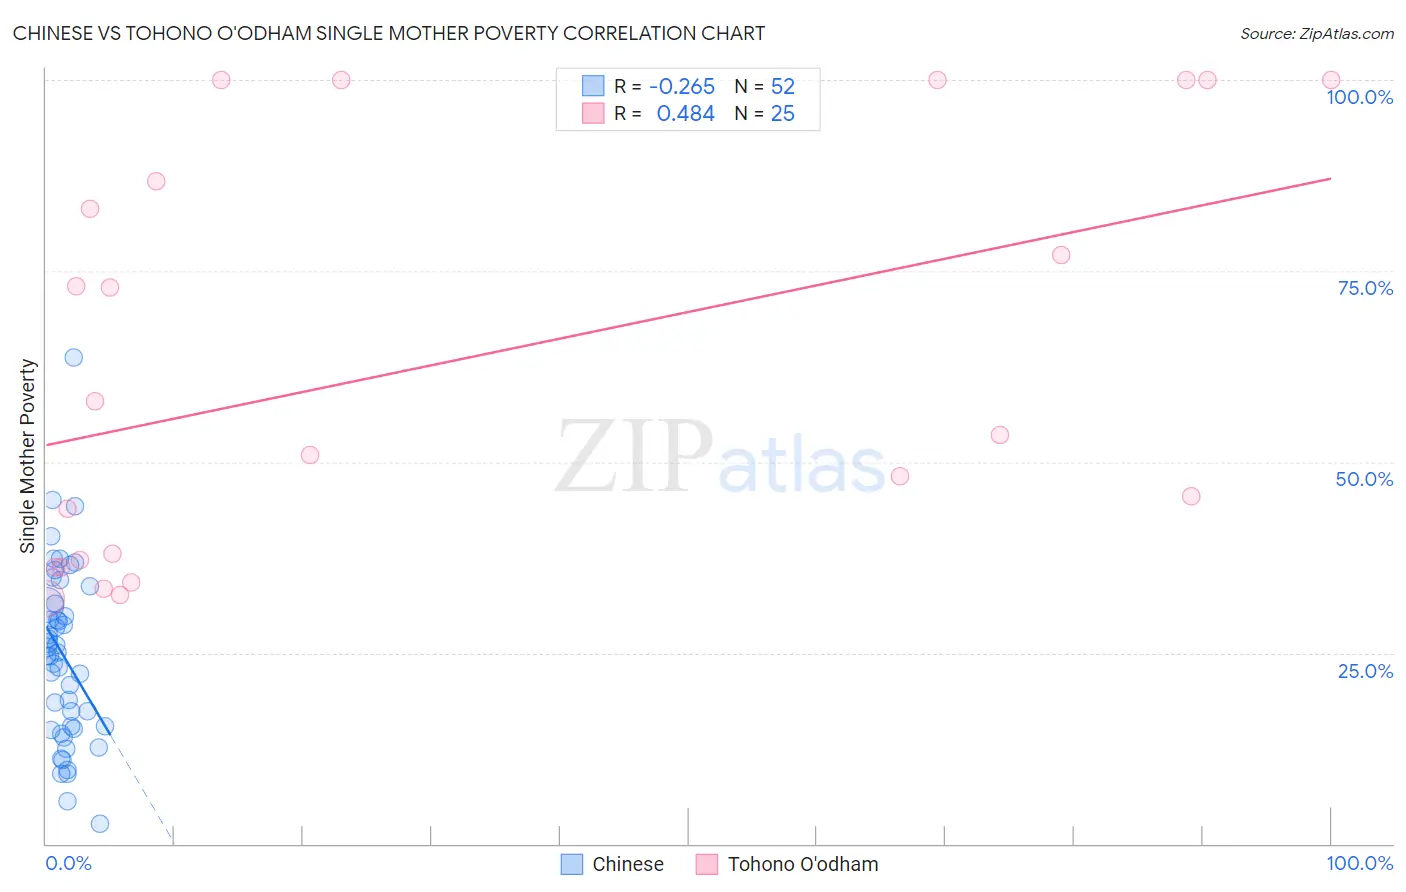
Chinese vs Tohono O'odham Single Mother Poverty Correlation Chart
The statistical analysis conducted on geographies consisting of 64,411,570 people shows a weak negative correlation between the proportion of Chinese and poverty level among single mothers in the United States with a correlation coefficient (R) of -0.265 and weighted average of 24.6%. Similarly, the statistical analysis conducted on geographies consisting of 58,556,531 people shows a moderate positive correlation between the proportion of Tohono O'odham and poverty level among single mothers in the United States with a correlation coefficient (R) of 0.484 and weighted average of 43.0%, a difference of 74.8%.
Single Mother Poverty Correlation Summary
| Measurement | Chinese | Tohono O'odham |
| Minimum | 2.6% | 32.1% |
| Maximum | 63.6% | 100.0% |
| Range | 61.1% | 67.9% |
| Mean | 24.6% | 62.9% |
| Median | 24.8% | 53.5% |
| Interquartile 25% (IQ1) | 15.2% | 36.6% |
| Interquartile 75% (IQ3) | 31.4% | 93.4% |
| Interquartile Range (IQR) | 16.2% | 56.8% |
| Standard Deviation (Sample) | 11.6% | 26.7% |
| Standard Deviation (Population) | 11.4% | 26.1% |
Similar Demographics by Single Mother Poverty
Demographics Similar to Chinese by Single Mother Poverty
In terms of single mother poverty, the demographic groups most similar to Chinese are Thai (24.5%, a difference of 0.54%), Immigrants from Hong Kong (24.4%, a difference of 1.0%), Filipino (24.3%, a difference of 1.3%), Immigrants from Iran (25.1%, a difference of 2.0%), and Immigrants from Lithuania (25.2%, a difference of 2.4%).
| Demographics | Rating | Rank | Single Mother Poverty |
| Assyrians/Chaldeans/Syriacs | 100.0 /100 | #1 | Exceptional 23.8% |
| Immigrants | India | 100.0 /100 | #2 | Exceptional 23.8% |
| Immigrants | Taiwan | 100.0 /100 | #3 | Exceptional 23.9% |
| Filipinos | 100.0 /100 | #4 | Exceptional 24.3% |
| Immigrants | Hong Kong | 100.0 /100 | #5 | Exceptional 24.4% |
| Thais | 100.0 /100 | #6 | Exceptional 24.5% |
| Chinese | 100.0 /100 | #7 | Exceptional 24.6% |
| Immigrants | Iran | 100.0 /100 | #8 | Exceptional 25.1% |
| Immigrants | Lithuania | 100.0 /100 | #9 | Exceptional 25.2% |
| Immigrants | South Central Asia | 100.0 /100 | #10 | Exceptional 25.3% |
| Iranians | 100.0 /100 | #11 | Exceptional 25.5% |
| Bhutanese | 100.0 /100 | #12 | Exceptional 25.6% |
| Indians (Asian) | 100.0 /100 | #13 | Exceptional 25.8% |
| Immigrants | Singapore | 100.0 /100 | #14 | Exceptional 25.8% |
| Immigrants | Ireland | 100.0 /100 | #15 | Exceptional 25.8% |
Demographics Similar to Tohono O'odham by Single Mother Poverty
In terms of single mother poverty, the demographic groups most similar to Tohono O'odham are Lumbee (43.2%, a difference of 0.49%), Houma (43.5%, a difference of 1.1%), Puerto Rican (44.5%, a difference of 3.5%), Cajun (40.3%, a difference of 6.7%), and Navajo (40.2%, a difference of 7.0%).
| Demographics | Rating | Rank | Single Mother Poverty |
| Menominee | 0.0 /100 | #333 | Tragic 37.1% |
| Pueblo | 0.0 /100 | #334 | Tragic 37.2% |
| Yuman | 0.0 /100 | #335 | Tragic 37.8% |
| Cheyenne | 0.0 /100 | #336 | Tragic 38.5% |
| Immigrants | Yemen | 0.0 /100 | #337 | Tragic 38.5% |
| Pima | 0.0 /100 | #338 | Tragic 38.6% |
| Crow | 0.0 /100 | #339 | Tragic 38.6% |
| Sioux | 0.0 /100 | #340 | Tragic 38.8% |
| Colville | 0.0 /100 | #341 | Tragic 39.3% |
| Navajo | 0.0 /100 | #342 | Tragic 40.2% |
| Cajuns | 0.0 /100 | #343 | Tragic 40.3% |
| Tohono O'odham | 0.0 /100 | #344 | Tragic 43.0% |
| Lumbee | 0.0 /100 | #345 | Tragic 43.2% |
| Houma | 0.0 /100 | #346 | Tragic 43.5% |
| Puerto Ricans | 0.0 /100 | #347 | Tragic 44.5% |