Alaska Native vs Tohono O'odham Single Mother Poverty
COMPARE
Alaska Native
Tohono O'odham
Single Mother Poverty
Single Mother Poverty Comparison
Alaska Natives
Tohono O'odham
30.9%
SINGLE MOTHER POVERTY
0.6/ 100
METRIC RATING
252nd/ 347
METRIC RANK
43.0%
SINGLE MOTHER POVERTY
0.0/ 100
METRIC RATING
344th/ 347
METRIC RANK
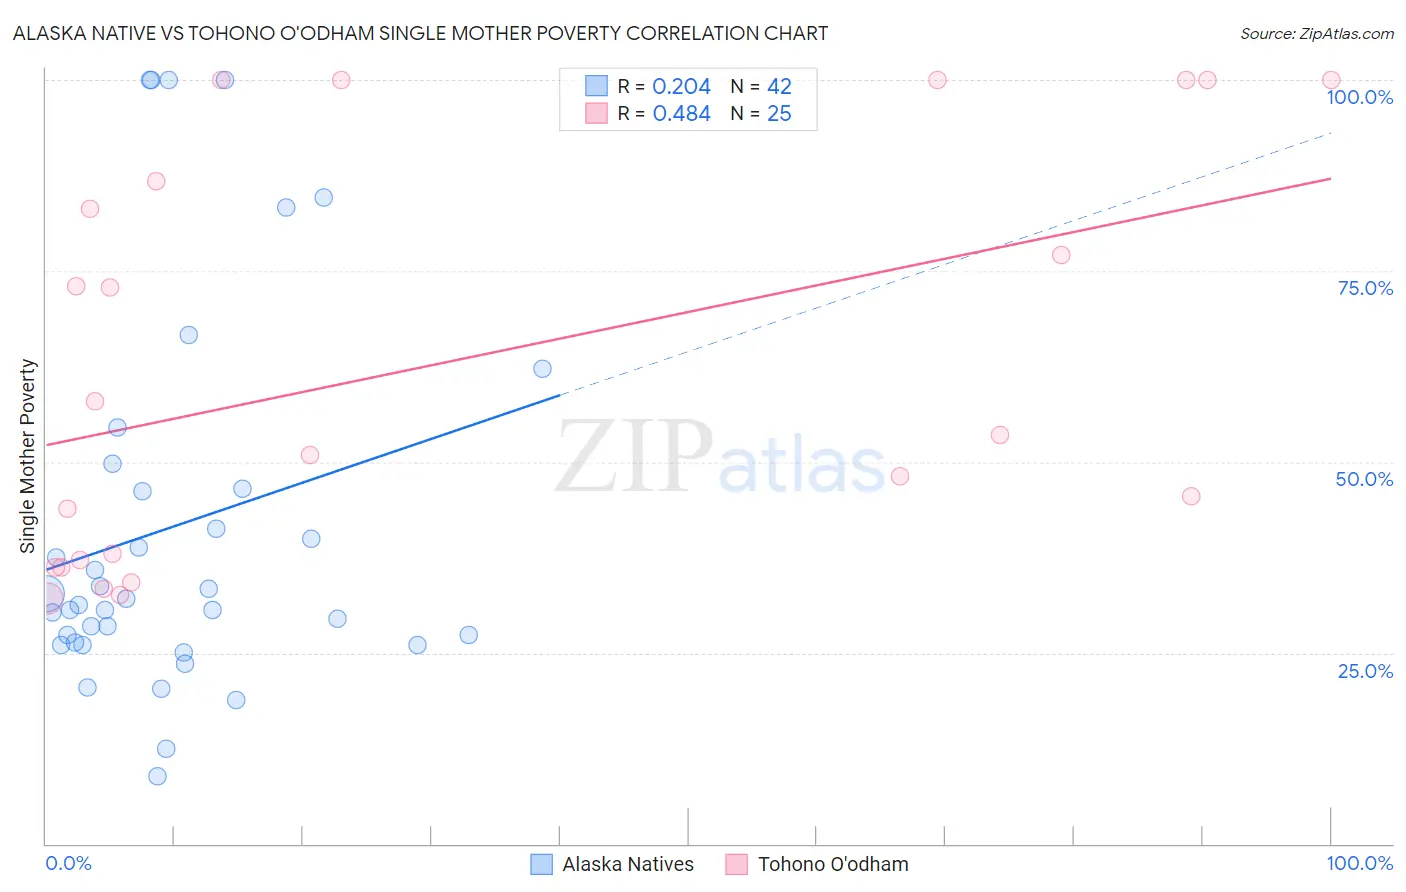
Alaska Native vs Tohono O'odham Single Mother Poverty Correlation Chart
The statistical analysis conducted on geographies consisting of 76,488,214 people shows a weak positive correlation between the proportion of Alaska Natives and poverty level among single mothers in the United States with a correlation coefficient (R) of 0.204 and weighted average of 30.9%. Similarly, the statistical analysis conducted on geographies consisting of 58,556,531 people shows a moderate positive correlation between the proportion of Tohono O'odham and poverty level among single mothers in the United States with a correlation coefficient (R) of 0.484 and weighted average of 43.0%, a difference of 39.2%.
Single Mother Poverty Correlation Summary
| Measurement | Alaska Native | Tohono O'odham |
| Minimum | 8.8% | 32.1% |
| Maximum | 100.0% | 100.0% |
| Range | 91.2% | 67.9% |
| Mean | 41.6% | 62.9% |
| Median | 31.7% | 53.5% |
| Interquartile 25% (IQ1) | 26.3% | 36.6% |
| Interquartile 75% (IQ3) | 46.5% | 93.4% |
| Interquartile Range (IQR) | 20.2% | 56.8% |
| Standard Deviation (Sample) | 24.9% | 26.7% |
| Standard Deviation (Population) | 24.6% | 26.1% |
Similar Demographics by Single Mother Poverty
Demographics Similar to Alaska Natives by Single Mother Poverty
In terms of single mother poverty, the demographic groups most similar to Alaska Natives are Tlingit-Haida (30.9%, a difference of 0.010%), Celtic (30.9%, a difference of 0.030%), Vietnamese (30.9%, a difference of 0.13%), Senegalese (31.0%, a difference of 0.18%), and Cape Verdean (30.8%, a difference of 0.28%).
| Demographics | Rating | Rank | Single Mother Poverty |
| Barbadians | 1.3 /100 | #245 | Tragic 30.7% |
| Ecuadorians | 0.9 /100 | #246 | Tragic 30.8% |
| West Indians | 0.9 /100 | #247 | Tragic 30.8% |
| French Canadians | 0.9 /100 | #248 | Tragic 30.8% |
| Cape Verdeans | 0.8 /100 | #249 | Tragic 30.8% |
| Vietnamese | 0.7 /100 | #250 | Tragic 30.9% |
| Tlingit-Haida | 0.6 /100 | #251 | Tragic 30.9% |
| Alaska Natives | 0.6 /100 | #252 | Tragic 30.9% |
| Celtics | 0.6 /100 | #253 | Tragic 30.9% |
| Senegalese | 0.5 /100 | #254 | Tragic 31.0% |
| Belizeans | 0.5 /100 | #255 | Tragic 31.0% |
| Immigrants | West Indies | 0.4 /100 | #256 | Tragic 31.1% |
| Immigrants | Bahamas | 0.4 /100 | #257 | Tragic 31.1% |
| Immigrants | Caribbean | 0.4 /100 | #258 | Tragic 31.1% |
| Immigrants | Bangladesh | 0.4 /100 | #259 | Tragic 31.1% |
Demographics Similar to Tohono O'odham by Single Mother Poverty
In terms of single mother poverty, the demographic groups most similar to Tohono O'odham are Lumbee (43.2%, a difference of 0.49%), Houma (43.5%, a difference of 1.1%), Puerto Rican (44.5%, a difference of 3.5%), Cajun (40.3%, a difference of 6.7%), and Navajo (40.2%, a difference of 7.0%).
| Demographics | Rating | Rank | Single Mother Poverty |
| Menominee | 0.0 /100 | #333 | Tragic 37.1% |
| Pueblo | 0.0 /100 | #334 | Tragic 37.2% |
| Yuman | 0.0 /100 | #335 | Tragic 37.8% |
| Cheyenne | 0.0 /100 | #336 | Tragic 38.5% |
| Immigrants | Yemen | 0.0 /100 | #337 | Tragic 38.5% |
| Pima | 0.0 /100 | #338 | Tragic 38.6% |
| Crow | 0.0 /100 | #339 | Tragic 38.6% |
| Sioux | 0.0 /100 | #340 | Tragic 38.8% |
| Colville | 0.0 /100 | #341 | Tragic 39.3% |
| Navajo | 0.0 /100 | #342 | Tragic 40.2% |
| Cajuns | 0.0 /100 | #343 | Tragic 40.3% |
| Tohono O'odham | 0.0 /100 | #344 | Tragic 43.0% |
| Lumbee | 0.0 /100 | #345 | Tragic 43.2% |
| Houma | 0.0 /100 | #346 | Tragic 43.5% |
| Puerto Ricans | 0.0 /100 | #347 | Tragic 44.5% |