Chickasaw vs Immigrants from India Single Mother Poverty
COMPARE
Chickasaw
Immigrants from India
Single Mother Poverty
Single Mother Poverty Comparison
Chickasaw
Immigrants from India
34.4%
SINGLE MOTHER POVERTY
0.0/ 100
METRIC RATING
314th/ 347
METRIC RANK
23.8%
SINGLE MOTHER POVERTY
100.0/ 100
METRIC RATING
2nd/ 347
METRIC RANK
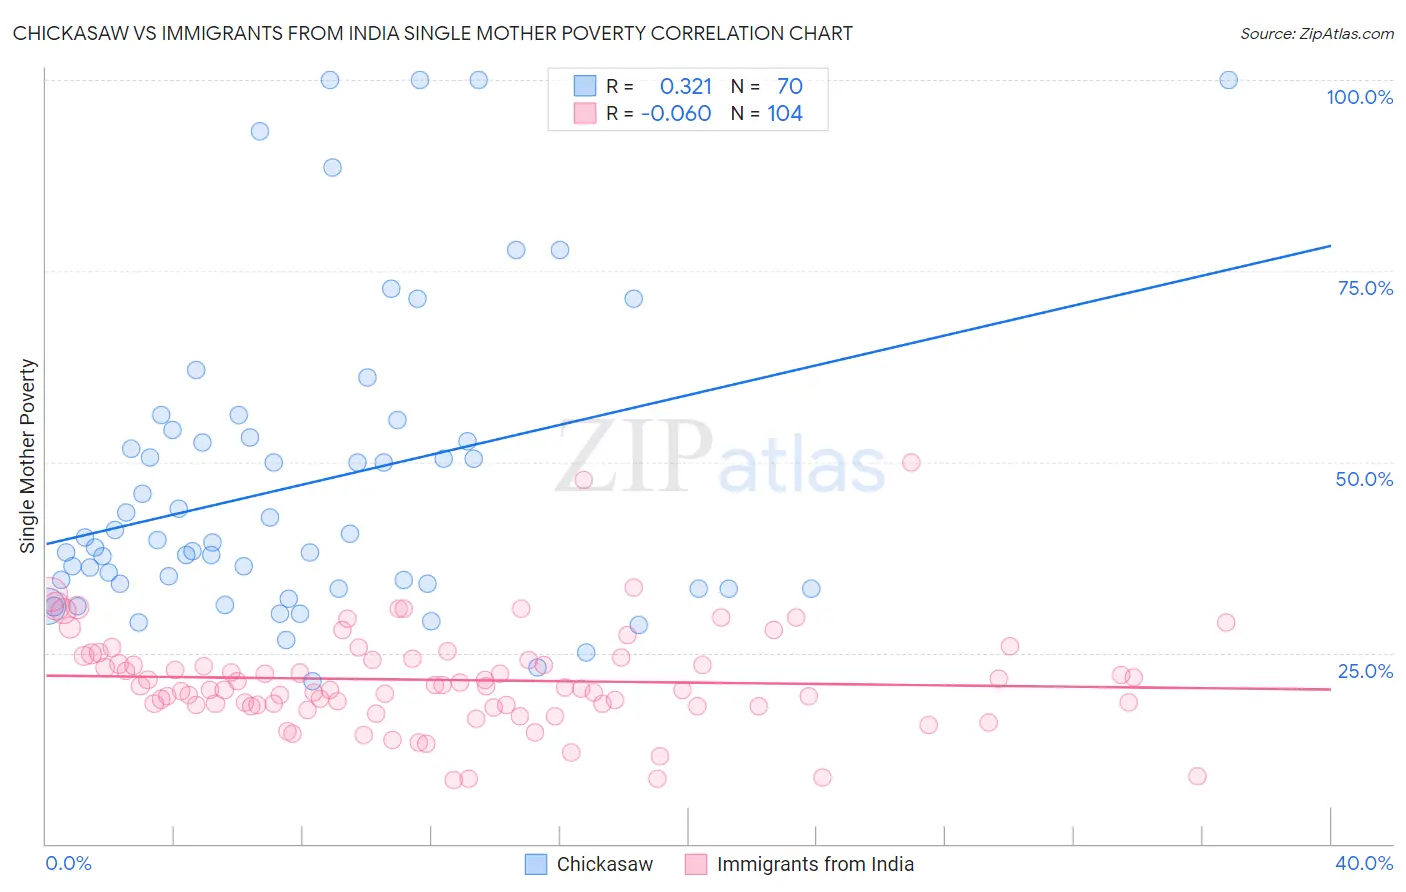
Chickasaw vs Immigrants from India Single Mother Poverty Correlation Chart
The statistical analysis conducted on geographies consisting of 146,526,184 people shows a mild positive correlation between the proportion of Chickasaw and poverty level among single mothers in the United States with a correlation coefficient (R) of 0.321 and weighted average of 34.4%. Similarly, the statistical analysis conducted on geographies consisting of 420,975,402 people shows a slight negative correlation between the proportion of Immigrants from India and poverty level among single mothers in the United States with a correlation coefficient (R) of -0.060 and weighted average of 23.8%, a difference of 44.6%.
Single Mother Poverty Correlation Summary
| Measurement | Chickasaw | Immigrants from India |
| Minimum | 21.2% | 8.3% |
| Maximum | 100.0% | 49.8% |
| Range | 78.7% | 41.5% |
| Mean | 47.2% | 21.4% |
| Median | 39.6% | 20.5% |
| Interquartile 25% (IQ1) | 33.3% | 18.1% |
| Interquartile 75% (IQ3) | 53.2% | 24.3% |
| Interquartile Range (IQR) | 19.9% | 6.2% |
| Standard Deviation (Sample) | 20.0% | 6.7% |
| Standard Deviation (Population) | 19.8% | 6.7% |
Similar Demographics by Single Mother Poverty
Demographics Similar to Chickasaw by Single Mother Poverty
In terms of single mother poverty, the demographic groups most similar to Chickasaw are Hopi (34.5%, a difference of 0.080%), Immigrants from Dominican Republic (34.4%, a difference of 0.17%), Dominican (34.5%, a difference of 0.20%), Central American Indian (34.3%, a difference of 0.26%), and Cherokee (34.5%, a difference of 0.30%).
| Demographics | Rating | Rank | Single Mother Poverty |
| Comanche | 0.0 /100 | #307 | Tragic 33.9% |
| Immigrants | Mexico | 0.0 /100 | #308 | Tragic 34.0% |
| Potawatomi | 0.0 /100 | #309 | Tragic 34.1% |
| Hondurans | 0.0 /100 | #310 | Tragic 34.2% |
| Alsatians | 0.0 /100 | #311 | Tragic 34.3% |
| Central American Indians | 0.0 /100 | #312 | Tragic 34.3% |
| Immigrants | Dominican Republic | 0.0 /100 | #313 | Tragic 34.4% |
| Chickasaw | 0.0 /100 | #314 | Tragic 34.4% |
| Hopi | 0.0 /100 | #315 | Tragic 34.5% |
| Dominicans | 0.0 /100 | #316 | Tragic 34.5% |
| Cherokee | 0.0 /100 | #317 | Tragic 34.5% |
| Immigrants | Honduras | 0.0 /100 | #318 | Tragic 34.7% |
| Chippewa | 0.0 /100 | #319 | Tragic 34.8% |
| Iroquois | 0.0 /100 | #320 | Tragic 34.8% |
| Paiute | 0.0 /100 | #321 | Tragic 35.1% |
Demographics Similar to Immigrants from India by Single Mother Poverty
In terms of single mother poverty, the demographic groups most similar to Immigrants from India are Assyrian/Chaldean/Syriac (23.8%, a difference of 0.020%), Immigrants from Taiwan (23.9%, a difference of 0.20%), Filipino (24.3%, a difference of 2.1%), Immigrants from Hong Kong (24.4%, a difference of 2.4%), and Thai (24.5%, a difference of 2.9%).
| Demographics | Rating | Rank | Single Mother Poverty |
| Assyrians/Chaldeans/Syriacs | 100.0 /100 | #1 | Exceptional 23.8% |
| Immigrants | India | 100.0 /100 | #2 | Exceptional 23.8% |
| Immigrants | Taiwan | 100.0 /100 | #3 | Exceptional 23.9% |
| Filipinos | 100.0 /100 | #4 | Exceptional 24.3% |
| Immigrants | Hong Kong | 100.0 /100 | #5 | Exceptional 24.4% |
| Thais | 100.0 /100 | #6 | Exceptional 24.5% |
| Chinese | 100.0 /100 | #7 | Exceptional 24.6% |
| Immigrants | Iran | 100.0 /100 | #8 | Exceptional 25.1% |
| Immigrants | Lithuania | 100.0 /100 | #9 | Exceptional 25.2% |
| Immigrants | South Central Asia | 100.0 /100 | #10 | Exceptional 25.3% |
| Iranians | 100.0 /100 | #11 | Exceptional 25.5% |
| Bhutanese | 100.0 /100 | #12 | Exceptional 25.6% |
| Indians (Asian) | 100.0 /100 | #13 | Exceptional 25.8% |
| Immigrants | Singapore | 100.0 /100 | #14 | Exceptional 25.8% |
| Immigrants | Ireland | 100.0 /100 | #15 | Exceptional 25.8% |