Chickasaw vs Czechoslovakian Single Mother Poverty
COMPARE
Chickasaw
Czechoslovakian
Single Mother Poverty
Single Mother Poverty Comparison
Chickasaw
Czechoslovakians
34.4%
SINGLE MOTHER POVERTY
0.0/ 100
METRIC RATING
314th/ 347
METRIC RANK
29.7%
SINGLE MOTHER POVERTY
16.1/ 100
METRIC RATING
205th/ 347
METRIC RANK
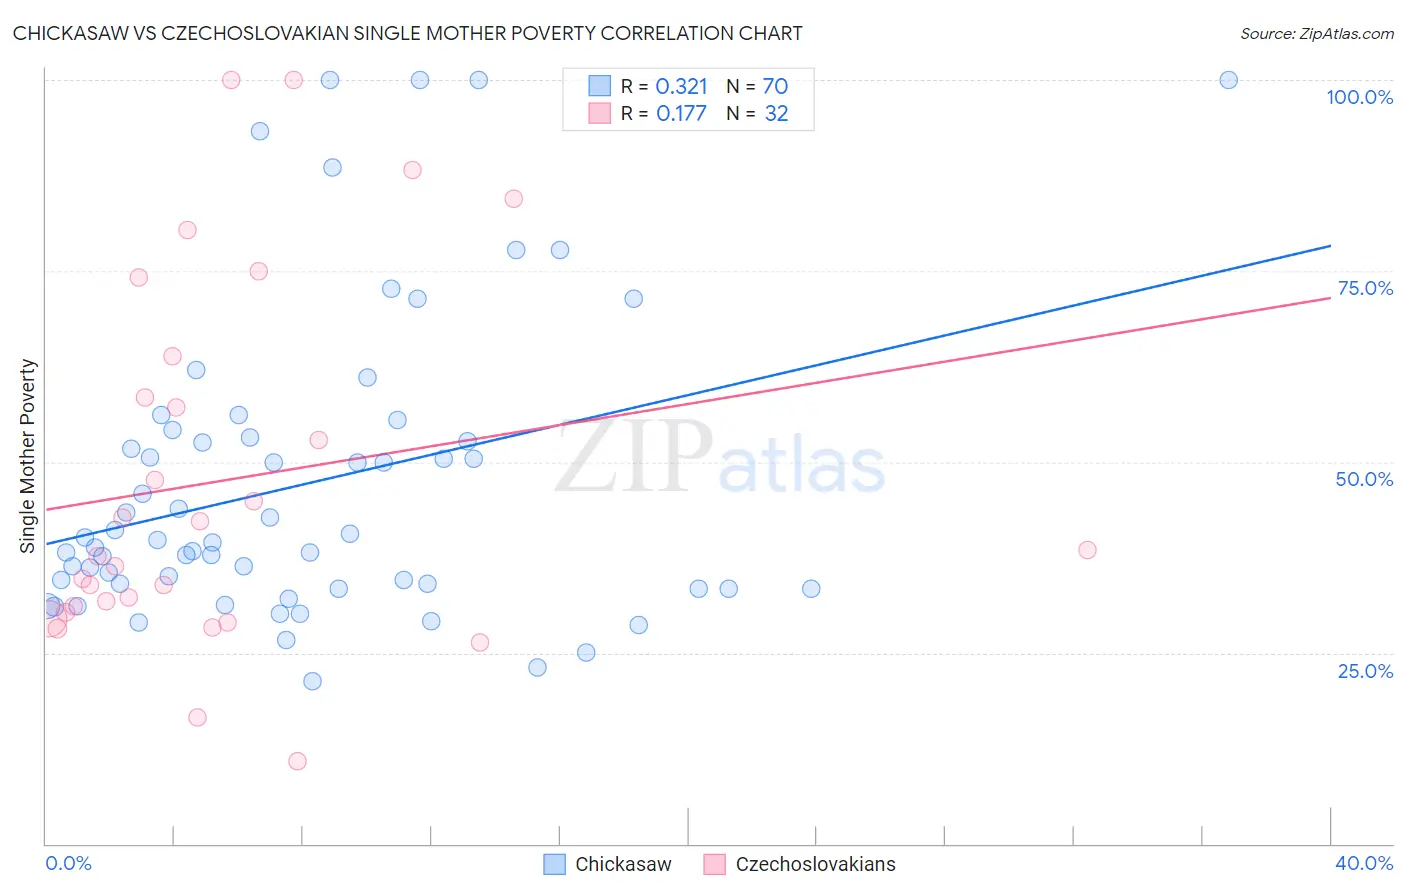
Chickasaw vs Czechoslovakian Single Mother Poverty Correlation Chart
The statistical analysis conducted on geographies consisting of 146,526,184 people shows a mild positive correlation between the proportion of Chickasaw and poverty level among single mothers in the United States with a correlation coefficient (R) of 0.321 and weighted average of 34.4%. Similarly, the statistical analysis conducted on geographies consisting of 358,570,470 people shows a poor positive correlation between the proportion of Czechoslovakians and poverty level among single mothers in the United States with a correlation coefficient (R) of 0.177 and weighted average of 29.7%, a difference of 15.7%.
Single Mother Poverty Correlation Summary
| Measurement | Chickasaw | Czechoslovakian |
| Minimum | 21.2% | 10.8% |
| Maximum | 100.0% | 100.0% |
| Range | 78.7% | 89.2% |
| Mean | 47.2% | 47.5% |
| Median | 39.6% | 38.1% |
| Interquartile 25% (IQ1) | 33.3% | 30.7% |
| Interquartile 75% (IQ3) | 53.2% | 61.2% |
| Interquartile Range (IQR) | 19.9% | 30.4% |
| Standard Deviation (Sample) | 20.0% | 23.9% |
| Standard Deviation (Population) | 19.8% | 23.5% |
Similar Demographics by Single Mother Poverty
Demographics Similar to Chickasaw by Single Mother Poverty
In terms of single mother poverty, the demographic groups most similar to Chickasaw are Hopi (34.5%, a difference of 0.080%), Immigrants from Dominican Republic (34.4%, a difference of 0.17%), Dominican (34.5%, a difference of 0.20%), Central American Indian (34.3%, a difference of 0.26%), and Cherokee (34.5%, a difference of 0.30%).
| Demographics | Rating | Rank | Single Mother Poverty |
| Comanche | 0.0 /100 | #307 | Tragic 33.9% |
| Immigrants | Mexico | 0.0 /100 | #308 | Tragic 34.0% |
| Potawatomi | 0.0 /100 | #309 | Tragic 34.1% |
| Hondurans | 0.0 /100 | #310 | Tragic 34.2% |
| Alsatians | 0.0 /100 | #311 | Tragic 34.3% |
| Central American Indians | 0.0 /100 | #312 | Tragic 34.3% |
| Immigrants | Dominican Republic | 0.0 /100 | #313 | Tragic 34.4% |
| Chickasaw | 0.0 /100 | #314 | Tragic 34.4% |
| Hopi | 0.0 /100 | #315 | Tragic 34.5% |
| Dominicans | 0.0 /100 | #316 | Tragic 34.5% |
| Cherokee | 0.0 /100 | #317 | Tragic 34.5% |
| Immigrants | Honduras | 0.0 /100 | #318 | Tragic 34.7% |
| Chippewa | 0.0 /100 | #319 | Tragic 34.8% |
| Iroquois | 0.0 /100 | #320 | Tragic 34.8% |
| Paiute | 0.0 /100 | #321 | Tragic 35.1% |
Demographics Similar to Czechoslovakians by Single Mother Poverty
In terms of single mother poverty, the demographic groups most similar to Czechoslovakians are Immigrants from Haiti (29.7%, a difference of 0.020%), Immigrants (29.7%, a difference of 0.040%), Immigrants from Panama (29.8%, a difference of 0.050%), Swiss (29.7%, a difference of 0.10%), and Malaysian (29.7%, a difference of 0.11%).
| Demographics | Rating | Rank | Single Mother Poverty |
| Trinidadians and Tobagonians | 21.7 /100 | #198 | Fair 29.6% |
| Cubans | 20.8 /100 | #199 | Fair 29.6% |
| Panamanians | 20.0 /100 | #200 | Fair 29.6% |
| Belgians | 18.8 /100 | #201 | Poor 29.7% |
| Malaysians | 17.4 /100 | #202 | Poor 29.7% |
| Swiss | 17.2 /100 | #203 | Poor 29.7% |
| Immigrants | Immigrants | 16.6 /100 | #204 | Poor 29.7% |
| Czechoslovakians | 16.1 /100 | #205 | Poor 29.7% |
| Immigrants | Haiti | 15.8 /100 | #206 | Poor 29.7% |
| Immigrants | Panama | 15.5 /100 | #207 | Poor 29.8% |
| Immigrants | Guyana | 14.7 /100 | #208 | Poor 29.8% |
| Irish | 13.9 /100 | #209 | Poor 29.8% |
| Haitians | 13.3 /100 | #210 | Poor 29.8% |
| Guyanese | 12.8 /100 | #211 | Poor 29.8% |
| Nicaraguans | 12.4 /100 | #212 | Poor 29.8% |