Celtic vs Immigrants from Panama Receiving Food Stamps
COMPARE
Celtic
Immigrants from Panama
Receiving Food Stamps
Receiving Food Stamps Comparison
Celtics
Immigrants from Panama
10.9%
RECEIVING FOOD STAMPS
87.8/ 100
METRIC RATING
140th/ 347
METRIC RANK
13.6%
RECEIVING FOOD STAMPS
1.0/ 100
METRIC RATING
242nd/ 347
METRIC RANK
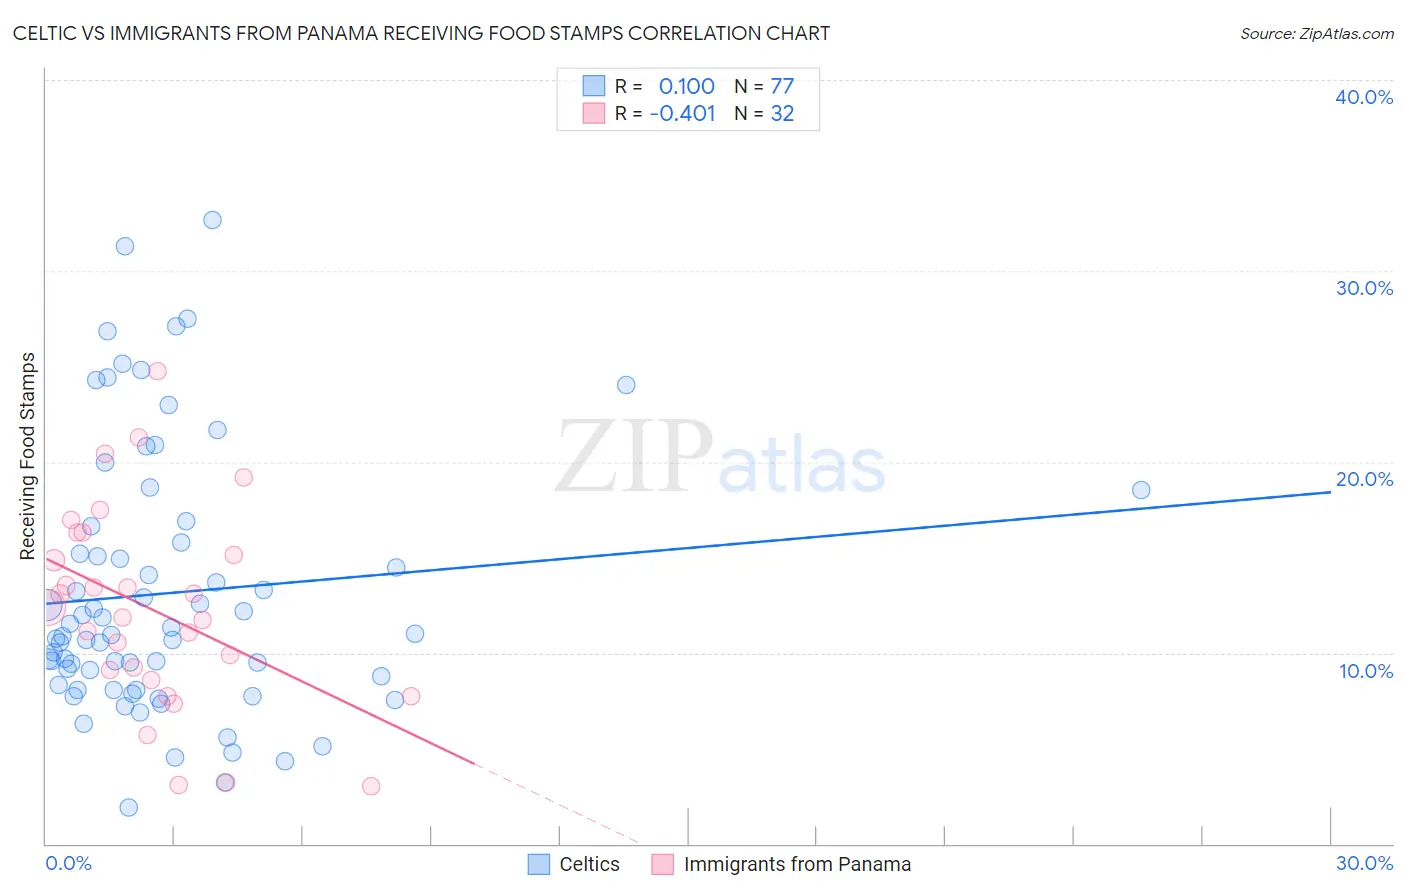
Celtic vs Immigrants from Panama Receiving Food Stamps Correlation Chart
The statistical analysis conducted on geographies consisting of 168,687,125 people shows a slight positive correlation between the proportion of Celtics and percentage of population receiving government assistance and/or food stamps in the United States with a correlation coefficient (R) of 0.100 and weighted average of 10.9%. Similarly, the statistical analysis conducted on geographies consisting of 221,020,717 people shows a moderate negative correlation between the proportion of Immigrants from Panama and percentage of population receiving government assistance and/or food stamps in the United States with a correlation coefficient (R) of -0.401 and weighted average of 13.6%, a difference of 24.8%.
Receiving Food Stamps Correlation Summary
| Measurement | Celtic | Immigrants from Panama |
| Minimum | 1.9% | 3.0% |
| Maximum | 32.7% | 24.8% |
| Range | 30.8% | 21.8% |
| Mean | 13.1% | 12.3% |
| Median | 11.0% | 12.1% |
| Interquartile 25% (IQ1) | 8.2% | 8.8% |
| Interquartile 75% (IQ3) | 16.2% | 15.7% |
| Interquartile Range (IQR) | 8.0% | 6.8% |
| Standard Deviation (Sample) | 6.9% | 5.3% |
| Standard Deviation (Population) | 6.8% | 5.2% |
Similar Demographics by Receiving Food Stamps
Demographics Similar to Celtics by Receiving Food Stamps
In terms of receiving food stamps, the demographic groups most similar to Celtics are Hmong (10.9%, a difference of 0.20%), Immigrants from Moldova (10.9%, a difference of 0.24%), Immigrants from Vietnam (11.0%, a difference of 0.36%), Chilean (11.0%, a difference of 0.53%), and Immigrants from Northern Africa (11.0%, a difference of 0.61%).
| Demographics | Rating | Rank | Receiving Food Stamps |
| Immigrants | Russia | 90.9 /100 | #133 | Exceptional 10.8% |
| Immigrants | Brazil | 90.3 /100 | #134 | Exceptional 10.8% |
| Argentineans | 90.2 /100 | #135 | Exceptional 10.8% |
| Slovaks | 89.8 /100 | #136 | Excellent 10.8% |
| Immigrants | Eastern Europe | 89.8 /100 | #137 | Excellent 10.8% |
| Immigrants | Moldova | 88.5 /100 | #138 | Excellent 10.9% |
| Hmong | 88.4 /100 | #139 | Excellent 10.9% |
| Celtics | 87.8 /100 | #140 | Excellent 10.9% |
| Immigrants | Vietnam | 86.7 /100 | #141 | Excellent 11.0% |
| Chileans | 86.2 /100 | #142 | Excellent 11.0% |
| Immigrants | Northern Africa | 86.0 /100 | #143 | Excellent 11.0% |
| Syrians | 85.5 /100 | #144 | Excellent 11.0% |
| Hungarians | 85.1 /100 | #145 | Excellent 11.0% |
| Taiwanese | 84.2 /100 | #146 | Excellent 11.0% |
| Whites/Caucasians | 83.9 /100 | #147 | Excellent 11.1% |
Demographics Similar to Immigrants from Panama by Receiving Food Stamps
In terms of receiving food stamps, the demographic groups most similar to Immigrants from Panama are Choctaw (13.6%, a difference of 0.18%), Somali (13.7%, a difference of 0.19%), Cajun (13.7%, a difference of 0.35%), Immigrants from Somalia (13.7%, a difference of 0.39%), and Iroquois (13.5%, a difference of 0.62%).
| Demographics | Rating | Rank | Receiving Food Stamps |
| Immigrants | Zaire | 1.9 /100 | #235 | Tragic 13.4% |
| Crow | 1.6 /100 | #236 | Tragic 13.4% |
| Immigrants | El Salvador | 1.5 /100 | #237 | Tragic 13.5% |
| French American Indians | 1.4 /100 | #238 | Tragic 13.5% |
| Immigrants | Micronesia | 1.3 /100 | #239 | Tragic 13.5% |
| Iroquois | 1.2 /100 | #240 | Tragic 13.5% |
| Choctaw | 1.0 /100 | #241 | Tragic 13.6% |
| Immigrants | Panama | 1.0 /100 | #242 | Tragic 13.6% |
| Somalis | 0.9 /100 | #243 | Tragic 13.7% |
| Cajuns | 0.9 /100 | #244 | Tragic 13.7% |
| Immigrants | Somalia | 0.9 /100 | #245 | Tragic 13.7% |
| Cree | 0.8 /100 | #246 | Tragic 13.7% |
| Mexican American Indians | 0.7 /100 | #247 | Tragic 13.8% |
| Immigrants | Laos | 0.7 /100 | #248 | Tragic 13.8% |
| Indonesians | 0.6 /100 | #249 | Tragic 13.9% |