Seminole vs Immigrants from Panama Receiving Food Stamps
COMPARE
Seminole
Immigrants from Panama
Receiving Food Stamps
Receiving Food Stamps Comparison
Seminole
Immigrants from Panama
14.8%
RECEIVING FOOD STAMPS
0.1/ 100
METRIC RATING
277th/ 347
METRIC RANK
13.6%
RECEIVING FOOD STAMPS
1.0/ 100
METRIC RATING
242nd/ 347
METRIC RANK
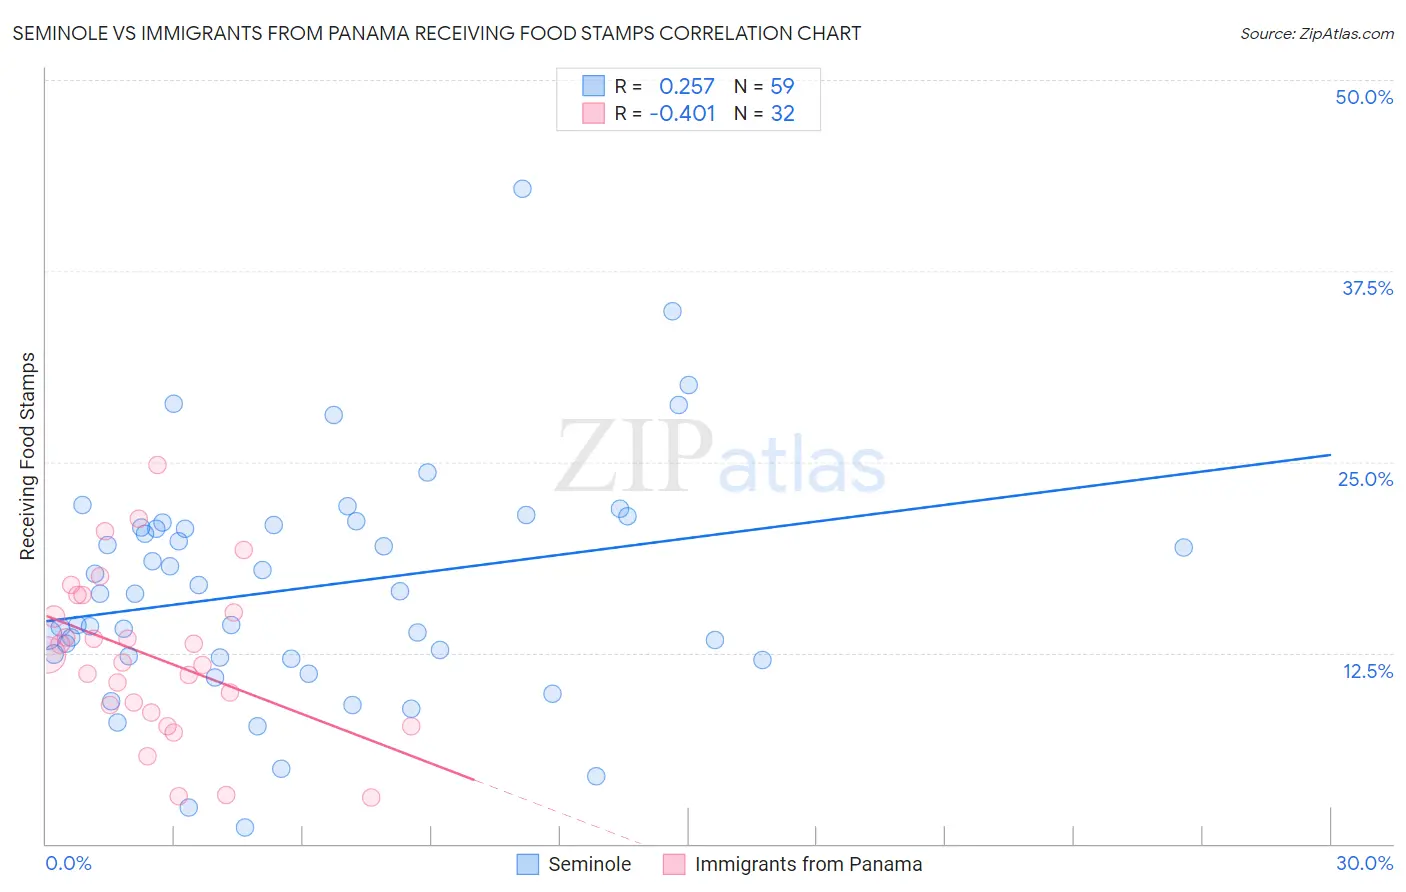
Seminole vs Immigrants from Panama Receiving Food Stamps Correlation Chart
The statistical analysis conducted on geographies consisting of 118,279,359 people shows a weak positive correlation between the proportion of Seminole and percentage of population receiving government assistance and/or food stamps in the United States with a correlation coefficient (R) of 0.257 and weighted average of 14.8%. Similarly, the statistical analysis conducted on geographies consisting of 221,020,717 people shows a moderate negative correlation between the proportion of Immigrants from Panama and percentage of population receiving government assistance and/or food stamps in the United States with a correlation coefficient (R) of -0.401 and weighted average of 13.6%, a difference of 8.6%.
Receiving Food Stamps Correlation Summary
| Measurement | Seminole | Immigrants from Panama |
| Minimum | 1.1% | 3.0% |
| Maximum | 42.9% | 24.8% |
| Range | 41.8% | 21.8% |
| Mean | 16.8% | 12.3% |
| Median | 16.4% | 12.1% |
| Interquartile 25% (IQ1) | 12.2% | 8.8% |
| Interquartile 75% (IQ3) | 20.9% | 15.7% |
| Interquartile Range (IQR) | 8.7% | 6.8% |
| Standard Deviation (Sample) | 7.6% | 5.3% |
| Standard Deviation (Population) | 7.5% | 5.2% |
Similar Demographics by Receiving Food Stamps
Demographics Similar to Seminole by Receiving Food Stamps
In terms of receiving food stamps, the demographic groups most similar to Seminole are Liberian (14.8%, a difference of 0.050%), Belizean (14.8%, a difference of 0.13%), Kiowa (14.9%, a difference of 0.40%), Ecuadorian (14.9%, a difference of 0.45%), and Ute (14.7%, a difference of 0.76%).
| Demographics | Rating | Rank | Receiving Food Stamps |
| Mexicans | 0.1 /100 | #270 | Tragic 14.6% |
| Immigrants | Guatemala | 0.1 /100 | #271 | Tragic 14.6% |
| Chippewa | 0.1 /100 | #272 | Tragic 14.7% |
| Alaskan Athabascans | 0.1 /100 | #273 | Tragic 14.7% |
| Immigrants | Western Africa | 0.1 /100 | #274 | Tragic 14.7% |
| Ute | 0.1 /100 | #275 | Tragic 14.7% |
| Liberians | 0.1 /100 | #276 | Tragic 14.8% |
| Seminole | 0.1 /100 | #277 | Tragic 14.8% |
| Belizeans | 0.1 /100 | #278 | Tragic 14.8% |
| Kiowa | 0.0 /100 | #279 | Tragic 14.9% |
| Ecuadorians | 0.0 /100 | #280 | Tragic 14.9% |
| Spanish American Indians | 0.0 /100 | #281 | Tragic 14.9% |
| Immigrants | Central America | 0.0 /100 | #282 | Tragic 15.0% |
| Bangladeshis | 0.0 /100 | #283 | Tragic 15.0% |
| Immigrants | Ecuador | 0.0 /100 | #284 | Tragic 15.0% |
Demographics Similar to Immigrants from Panama by Receiving Food Stamps
In terms of receiving food stamps, the demographic groups most similar to Immigrants from Panama are Choctaw (13.6%, a difference of 0.18%), Somali (13.7%, a difference of 0.19%), Cajun (13.7%, a difference of 0.35%), Immigrants from Somalia (13.7%, a difference of 0.39%), and Iroquois (13.5%, a difference of 0.62%).
| Demographics | Rating | Rank | Receiving Food Stamps |
| Immigrants | Zaire | 1.9 /100 | #235 | Tragic 13.4% |
| Crow | 1.6 /100 | #236 | Tragic 13.4% |
| Immigrants | El Salvador | 1.5 /100 | #237 | Tragic 13.5% |
| French American Indians | 1.4 /100 | #238 | Tragic 13.5% |
| Immigrants | Micronesia | 1.3 /100 | #239 | Tragic 13.5% |
| Iroquois | 1.2 /100 | #240 | Tragic 13.5% |
| Choctaw | 1.0 /100 | #241 | Tragic 13.6% |
| Immigrants | Panama | 1.0 /100 | #242 | Tragic 13.6% |
| Somalis | 0.9 /100 | #243 | Tragic 13.7% |
| Cajuns | 0.9 /100 | #244 | Tragic 13.7% |
| Immigrants | Somalia | 0.9 /100 | #245 | Tragic 13.7% |
| Cree | 0.8 /100 | #246 | Tragic 13.7% |
| Mexican American Indians | 0.7 /100 | #247 | Tragic 13.8% |
| Immigrants | Laos | 0.7 /100 | #248 | Tragic 13.8% |
| Indonesians | 0.6 /100 | #249 | Tragic 13.9% |