Cape Verdean vs Immigrants from Singapore Poverty
COMPARE
Cape Verdean
Immigrants from Singapore
Poverty
Poverty Comparison
Cape Verdeans
Immigrants from Singapore
14.4%
POVERTY
0.1/ 100
METRIC RATING
260th/ 347
METRIC RANK
10.9%
POVERTY
99.2/ 100
METRIC RATING
43rd/ 347
METRIC RANK
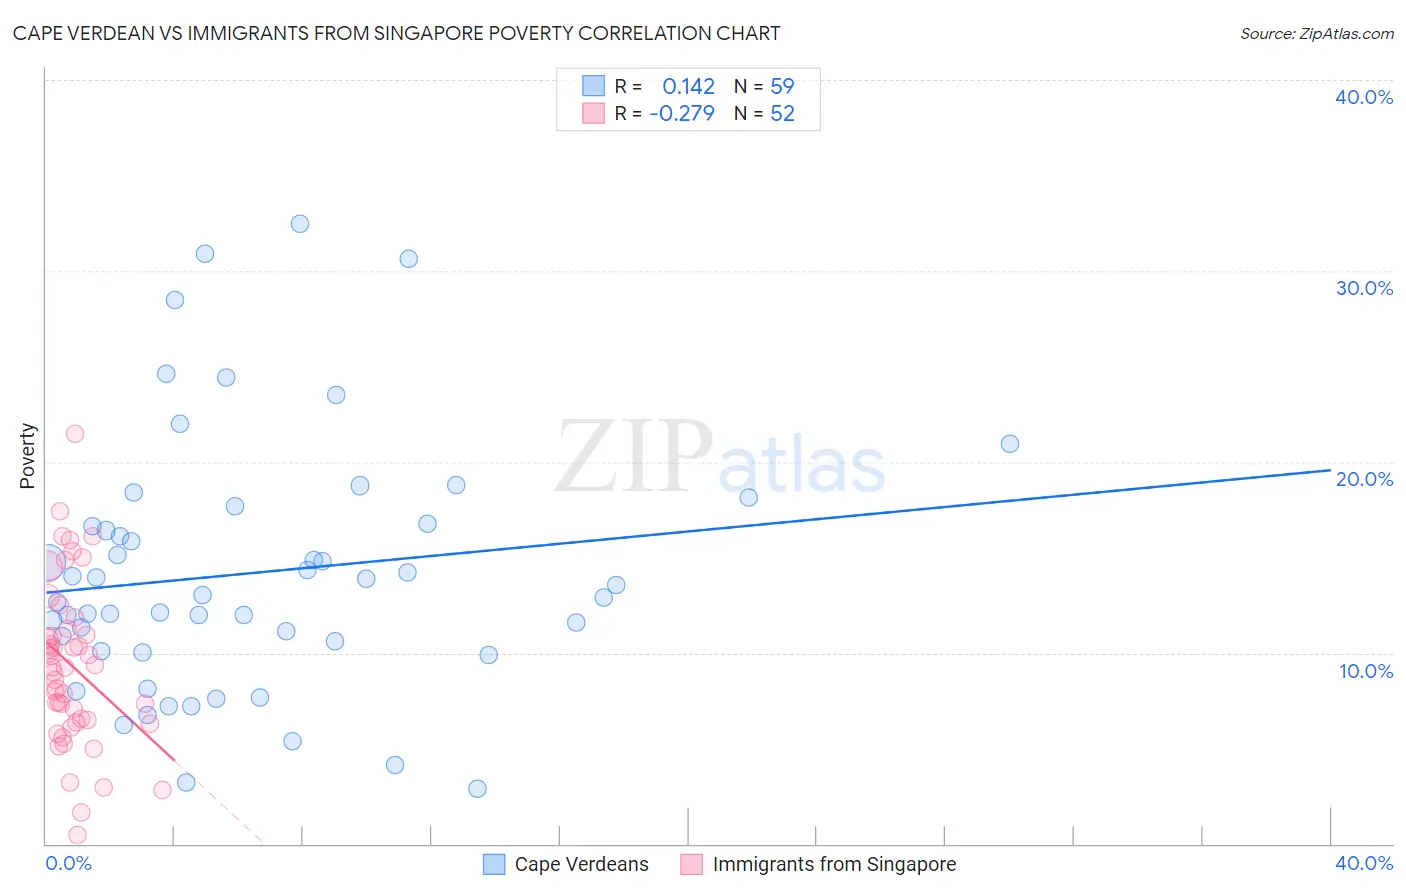
Cape Verdean vs Immigrants from Singapore Poverty Correlation Chart
The statistical analysis conducted on geographies consisting of 107,560,730 people shows a poor positive correlation between the proportion of Cape Verdeans and poverty level in the United States with a correlation coefficient (R) of 0.142 and weighted average of 14.4%. Similarly, the statistical analysis conducted on geographies consisting of 137,414,586 people shows a weak negative correlation between the proportion of Immigrants from Singapore and poverty level in the United States with a correlation coefficient (R) of -0.279 and weighted average of 10.9%, a difference of 31.8%.
Poverty Correlation Summary
| Measurement | Cape Verdean | Immigrants from Singapore |
| Minimum | 2.9% | 0.45% |
| Maximum | 32.5% | 21.5% |
| Range | 29.6% | 21.0% |
| Mean | 14.2% | 9.3% |
| Median | 13.0% | 9.2% |
| Interquartile 25% (IQ1) | 10.1% | 6.4% |
| Interquartile 75% (IQ3) | 16.7% | 11.1% |
| Interquartile Range (IQR) | 6.6% | 4.7% |
| Standard Deviation (Sample) | 6.6% | 4.3% |
| Standard Deviation (Population) | 6.6% | 4.2% |
Similar Demographics by Poverty
Demographics Similar to Cape Verdeans by Poverty
In terms of poverty, the demographic groups most similar to Cape Verdeans are Cherokee (14.4%, a difference of 0.020%), Immigrants from Nicaragua (14.3%, a difference of 0.080%), Immigrants from Liberia (14.4%, a difference of 0.18%), Ottawa (14.3%, a difference of 0.35%), and Trinidadian and Tobagonian (14.3%, a difference of 0.36%).
| Demographics | Rating | Rank | Poverty |
| Immigrants | Trinidad and Tobago | 0.2 /100 | #253 | Tragic 14.2% |
| Immigrants | El Salvador | 0.1 /100 | #254 | Tragic 14.3% |
| Immigrants | Ecuador | 0.1 /100 | #255 | Tragic 14.3% |
| Mexican American Indians | 0.1 /100 | #256 | Tragic 14.3% |
| Trinidadians and Tobagonians | 0.1 /100 | #257 | Tragic 14.3% |
| Ottawa | 0.1 /100 | #258 | Tragic 14.3% |
| Immigrants | Nicaragua | 0.1 /100 | #259 | Tragic 14.3% |
| Cape Verdeans | 0.1 /100 | #260 | Tragic 14.4% |
| Cherokee | 0.1 /100 | #261 | Tragic 14.4% |
| Immigrants | Liberia | 0.1 /100 | #262 | Tragic 14.4% |
| Jamaicans | 0.1 /100 | #263 | Tragic 14.4% |
| Immigrants | Jamaica | 0.1 /100 | #264 | Tragic 14.4% |
| Immigrants | Guyana | 0.1 /100 | #265 | Tragic 14.5% |
| Guyanese | 0.1 /100 | #266 | Tragic 14.5% |
| Iroquois | 0.1 /100 | #267 | Tragic 14.5% |
Demographics Similar to Immigrants from Singapore by Poverty
In terms of poverty, the demographic groups most similar to Immigrants from Singapore are Korean (10.9%, a difference of 0.050%), Immigrants from Moldova (10.9%, a difference of 0.14%), Immigrants from Iran (10.9%, a difference of 0.27%), Russian (10.9%, a difference of 0.36%), and Immigrants from Pakistan (10.8%, a difference of 0.41%).
| Demographics | Rating | Rank | Poverty |
| Cypriots | 99.3 /100 | #36 | Exceptional 10.8% |
| Immigrants | Greece | 99.3 /100 | #37 | Exceptional 10.8% |
| Czechs | 99.3 /100 | #38 | Exceptional 10.8% |
| Immigrants | Pakistan | 99.3 /100 | #39 | Exceptional 10.8% |
| Russians | 99.3 /100 | #40 | Exceptional 10.9% |
| Immigrants | Iran | 99.2 /100 | #41 | Exceptional 10.9% |
| Koreans | 99.2 /100 | #42 | Exceptional 10.9% |
| Immigrants | Singapore | 99.2 /100 | #43 | Exceptional 10.9% |
| Immigrants | Moldova | 99.1 /100 | #44 | Exceptional 10.9% |
| Turks | 98.9 /100 | #45 | Exceptional 11.0% |
| Immigrants | Czechoslovakia | 98.9 /100 | #46 | Exceptional 11.0% |
| Immigrants | Romania | 98.9 /100 | #47 | Exceptional 11.0% |
| Slovenes | 98.9 /100 | #48 | Exceptional 11.0% |
| Immigrants | Japan | 98.9 /100 | #49 | Exceptional 11.0% |
| Asians | 98.9 /100 | #50 | Exceptional 11.0% |