Cape Verdean vs Immigrants from Singapore No Schooling Completed
COMPARE
Cape Verdean
Immigrants from Singapore
No Schooling Completed
No Schooling Completed Comparison
Cape Verdeans
Immigrants from Singapore
3.1%
NO SCHOOLING COMPLETED
0.0/ 100
METRIC RATING
317th/ 347
METRIC RANK
1.8%
NO SCHOOLING COMPLETED
98.0/ 100
METRIC RATING
100th/ 347
METRIC RANK
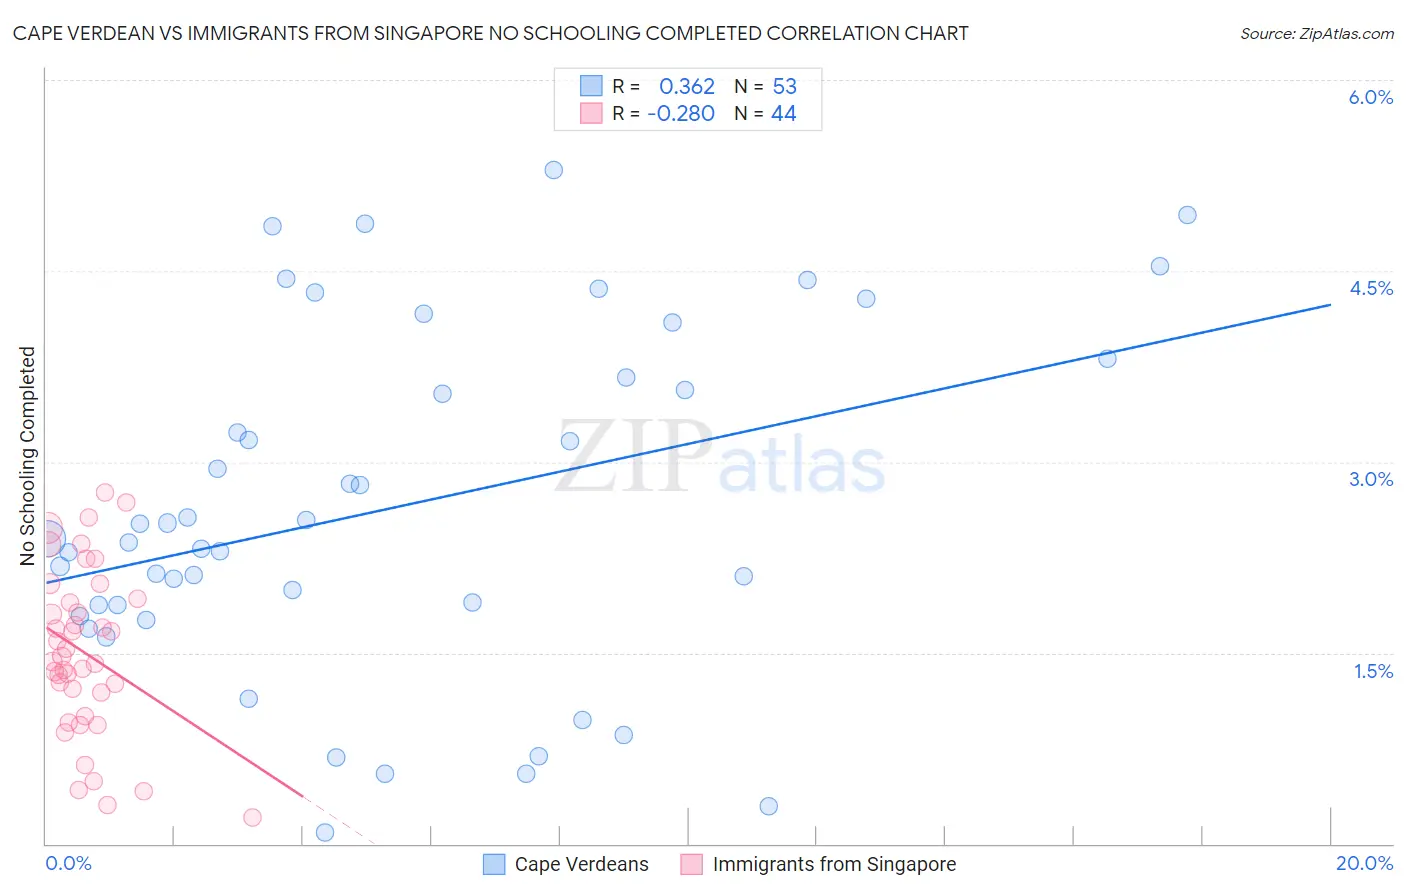
Cape Verdean vs Immigrants from Singapore No Schooling Completed Correlation Chart
The statistical analysis conducted on geographies consisting of 107,247,027 people shows a mild positive correlation between the proportion of Cape Verdeans and percentage of population with no schooling in the United States with a correlation coefficient (R) of 0.362 and weighted average of 3.1%. Similarly, the statistical analysis conducted on geographies consisting of 136,992,443 people shows a weak negative correlation between the proportion of Immigrants from Singapore and percentage of population with no schooling in the United States with a correlation coefficient (R) of -0.280 and weighted average of 1.8%, a difference of 70.7%.
No Schooling Completed Correlation Summary
| Measurement | Cape Verdean | Immigrants from Singapore |
| Minimum | 0.088% | 0.21% |
| Maximum | 5.3% | 2.8% |
| Range | 5.2% | 2.6% |
| Mean | 2.6% | 1.5% |
| Median | 2.4% | 1.5% |
| Interquartile 25% (IQ1) | 1.8% | 1.1% |
| Interquartile 75% (IQ3) | 3.7% | 1.9% |
| Interquartile Range (IQR) | 1.9% | 0.82% |
| Standard Deviation (Sample) | 1.3% | 0.65% |
| Standard Deviation (Population) | 1.3% | 0.64% |
Similar Demographics by No Schooling Completed
Demographics Similar to Cape Verdeans by No Schooling Completed
In terms of no schooling completed, the demographic groups most similar to Cape Verdeans are Immigrants from Ecuador (3.1%, a difference of 0.49%), Immigrants from Guyana (3.1%, a difference of 0.68%), Immigrants from Nicaragua (3.1%, a difference of 0.84%), Immigrants from Belize (3.1%, a difference of 1.1%), and Honduran (3.1%, a difference of 1.2%).
| Demographics | Rating | Rank | No Schooling Completed |
| Guyanese | 0.0 /100 | #310 | Tragic 3.0% |
| Immigrants | Azores | 0.0 /100 | #311 | Tragic 3.0% |
| Sri Lankans | 0.0 /100 | #312 | Tragic 3.0% |
| Hondurans | 0.0 /100 | #313 | Tragic 3.1% |
| Immigrants | Belize | 0.0 /100 | #314 | Tragic 3.1% |
| Immigrants | Nicaragua | 0.0 /100 | #315 | Tragic 3.1% |
| Immigrants | Ecuador | 0.0 /100 | #316 | Tragic 3.1% |
| Cape Verdeans | 0.0 /100 | #317 | Tragic 3.1% |
| Immigrants | Guyana | 0.0 /100 | #318 | Tragic 3.1% |
| Immigrants | Burma/Myanmar | 0.0 /100 | #319 | Tragic 3.1% |
| Immigrants | Bangladesh | 0.0 /100 | #320 | Tragic 3.1% |
| Immigrants | Laos | 0.0 /100 | #321 | Tragic 3.1% |
| Immigrants | Honduras | 0.0 /100 | #322 | Tragic 3.2% |
| Vietnamese | 0.0 /100 | #323 | Tragic 3.2% |
| Mexican American Indians | 0.0 /100 | #324 | Tragic 3.2% |
Demographics Similar to Immigrants from Singapore by No Schooling Completed
In terms of no schooling completed, the demographic groups most similar to Immigrants from Singapore are Choctaw (1.8%, a difference of 0.20%), Immigrants from Czechoslovakia (1.8%, a difference of 0.30%), Immigrants from Switzerland (1.8%, a difference of 0.30%), Basque (1.8%, a difference of 0.35%), and Iranian (1.8%, a difference of 0.39%).
| Demographics | Rating | Rank | No Schooling Completed |
| Turks | 98.7 /100 | #93 | Exceptional 1.8% |
| Immigrants | Nonimmigrants | 98.5 /100 | #94 | Exceptional 1.8% |
| Puget Sound Salish | 98.5 /100 | #95 | Exceptional 1.8% |
| Bhutanese | 98.4 /100 | #96 | Exceptional 1.8% |
| Immigrants | Ireland | 98.4 /100 | #97 | Exceptional 1.8% |
| Iranians | 98.2 /100 | #98 | Exceptional 1.8% |
| Choctaw | 98.1 /100 | #99 | Exceptional 1.8% |
| Immigrants | Singapore | 98.0 /100 | #100 | Exceptional 1.8% |
| Immigrants | Czechoslovakia | 97.9 /100 | #101 | Exceptional 1.8% |
| Immigrants | Switzerland | 97.9 /100 | #102 | Exceptional 1.8% |
| Basques | 97.9 /100 | #103 | Exceptional 1.8% |
| Thais | 97.5 /100 | #104 | Exceptional 1.8% |
| German Russians | 97.5 /100 | #105 | Exceptional 1.8% |
| Immigrants | France | 97.3 /100 | #106 | Exceptional 1.8% |
| Yugoslavians | 97.2 /100 | #107 | Exceptional 1.8% |