Canadian vs Celtic Single Female Poverty
COMPARE
Canadian
Celtic
Single Female Poverty
Single Female Poverty Comparison
Canadians
Celtics
21.1%
SINGLE FEMALE POVERTY
45.4/ 100
METRIC RATING
176th/ 347
METRIC RANK
22.7%
SINGLE FEMALE POVERTY
0.5/ 100
METRIC RATING
260th/ 347
METRIC RANK
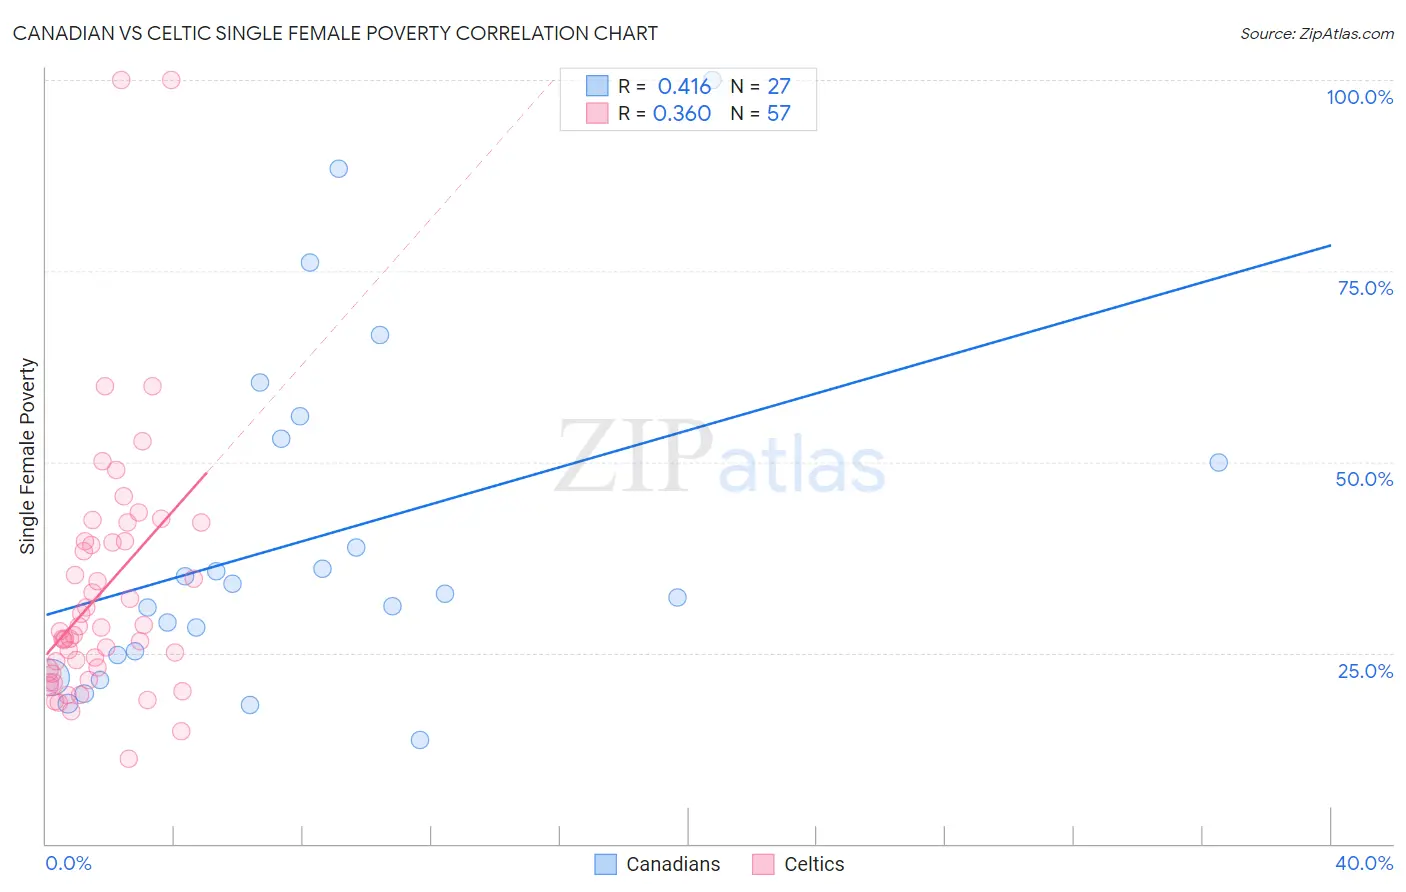
Canadian vs Celtic Single Female Poverty Correlation Chart
The statistical analysis conducted on geographies consisting of 428,352,495 people shows a moderate positive correlation between the proportion of Canadians and poverty level among single females in the United States with a correlation coefficient (R) of 0.416 and weighted average of 21.1%. Similarly, the statistical analysis conducted on geographies consisting of 167,592,415 people shows a mild positive correlation between the proportion of Celtics and poverty level among single females in the United States with a correlation coefficient (R) of 0.360 and weighted average of 22.7%, a difference of 7.9%.
Single Female Poverty Correlation Summary
| Measurement | Canadian | Celtic |
| Minimum | 13.6% | 11.1% |
| Maximum | 100.0% | 100.0% |
| Range | 86.4% | 88.9% |
| Mean | 39.9% | 33.1% |
| Median | 32.8% | 27.8% |
| Interquartile 25% (IQ1) | 24.7% | 22.5% |
| Interquartile 75% (IQ3) | 53.0% | 39.6% |
| Interquartile Range (IQR) | 28.3% | 17.1% |
| Standard Deviation (Sample) | 22.1% | 16.9% |
| Standard Deviation (Population) | 21.7% | 16.7% |
Similar Demographics by Single Female Poverty
Demographics Similar to Canadians by Single Female Poverty
In terms of single female poverty, the demographic groups most similar to Canadians are Scandinavian (21.1%, a difference of 0.010%), Immigrants from Bosnia and Herzegovina (21.1%, a difference of 0.040%), Czech (21.0%, a difference of 0.080%), British (21.1%, a difference of 0.16%), and Spanish American Indian (21.1%, a difference of 0.19%).
| Demographics | Rating | Rank | Single Female Poverty |
| Immigrants | Trinidad and Tobago | 56.3 /100 | #169 | Average 20.9% |
| New Zealanders | 53.2 /100 | #170 | Average 21.0% |
| Moroccans | 52.8 /100 | #171 | Average 21.0% |
| Guyanese | 52.0 /100 | #172 | Average 21.0% |
| Immigrants | Guyana | 50.6 /100 | #173 | Average 21.0% |
| Cubans | 50.0 /100 | #174 | Average 21.0% |
| Czechs | 46.8 /100 | #175 | Average 21.0% |
| Canadians | 45.4 /100 | #176 | Average 21.1% |
| Scandinavians | 45.2 /100 | #177 | Average 21.1% |
| Immigrants | Bosnia and Herzegovina | 44.9 /100 | #178 | Average 21.1% |
| British | 42.9 /100 | #179 | Average 21.1% |
| Spanish American Indians | 42.5 /100 | #180 | Average 21.1% |
| Europeans | 42.3 /100 | #181 | Average 21.1% |
| Slavs | 40.5 /100 | #182 | Average 21.1% |
| Slovaks | 39.7 /100 | #183 | Fair 21.1% |
Demographics Similar to Celtics by Single Female Poverty
In terms of single female poverty, the demographic groups most similar to Celtics are White/Caucasian (22.7%, a difference of 0.080%), Bahamian (22.7%, a difference of 0.21%), Immigrants from Cabo Verde (22.8%, a difference of 0.27%), Sudanese (22.6%, a difference of 0.41%), and British West Indian (22.8%, a difference of 0.52%).
| Demographics | Rating | Rank | Single Female Poverty |
| Immigrants | Liberia | 0.9 /100 | #253 | Tragic 22.5% |
| Immigrants | Burma/Myanmar | 0.8 /100 | #254 | Tragic 22.6% |
| Immigrants | Sudan | 0.8 /100 | #255 | Tragic 22.6% |
| Immigrants | Belize | 0.8 /100 | #256 | Tragic 22.6% |
| Sudanese | 0.7 /100 | #257 | Tragic 22.6% |
| Bahamians | 0.6 /100 | #258 | Tragic 22.7% |
| Whites/Caucasians | 0.6 /100 | #259 | Tragic 22.7% |
| Celtics | 0.5 /100 | #260 | Tragic 22.7% |
| Immigrants | Cabo Verde | 0.4 /100 | #261 | Tragic 22.8% |
| British West Indians | 0.4 /100 | #262 | Tragic 22.8% |
| Scotch-Irish | 0.3 /100 | #263 | Tragic 22.9% |
| Immigrants | Laos | 0.3 /100 | #264 | Tragic 22.9% |
| Central Americans | 0.2 /100 | #265 | Tragic 23.0% |
| Immigrants | Micronesia | 0.2 /100 | #266 | Tragic 23.0% |
| Senegalese | 0.2 /100 | #267 | Tragic 23.0% |